Unified provisioning to GCP
overview
Role
Lead Product Designer
Tools
Figma & Figma AI
Miro & Miro AI
Confluence
Jira
Copilot
Company
CVS Health
Duration
2 months,
Jun 25 - Aug 25
problem
Provisioning workflows across CVS Health were fragmented, inconsistent, and riddled with manual exceptions. Teams relied on multiple disconnected flows, undocumented steps, and shadow IT workarounds.
Divisional architects—responsible for spinning up 18–20 projects per week—faced repetitive data entry, approval bottlenecks, and unclear prerequisites. Each project required duplicative translation of business requirements into technical specs, often re-justified in bi-weekly VP calls.
The result was wasted time, inconsistent governance, and infrastructure friction that slowed innovation and undermined confidence in the platform.
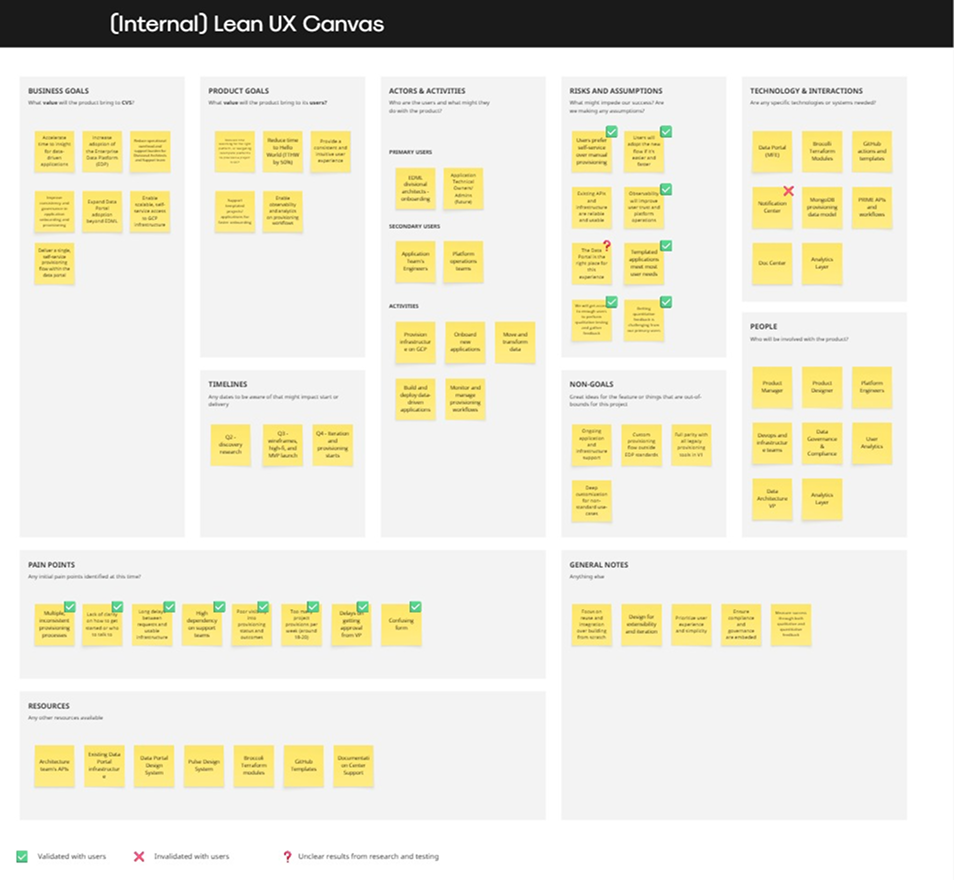
Lean UX Canvas
goal
Streamline the provisioning flow within our frontend interface - Data Portal - by:
Automating work and reducing approval bottlenecks
Clarifying prerequisites and eliminating redundant steps
Ensuring compliance and governance through embedded workflows
Delivering a consistent, transparent, and scalable provisioning experience for architects
OUTCOME
This initiative, delivered in only two months, resulted in an effective and quick unified provisioning flow that accelerated approvals, improved compliance, and boosted user satisfaction. By combining high-fidelity mockups, service blueprinting, and iterative testing, the project:
Reduced provisioning cycle time by 33%
Increased governance audit coverage by 35 points
Improved user satisfaction by 7 points
Established a scalable foundation for future onboarding and application flows
user archetype
The original user archetype, derived from the Enterprise Data User Archetypes study was based on the Technical Data Owner archetype. And required multiple user interviews with highly technical Data Architects, responsible for building and approving the pipelines of all our databases at CVS Health.
technical data owners / DATA ARCHITECTS
Data Literacy: High (on a scale Low-Medium-High)
Goals
Deliver infrastructure quickly and consistently.
Minimize manual overhead while ensuring compliance.
Maintain visibility and traceability across workflows.
Behaviors
Translate business needs into scalable, compliant infrastructure.
Coordinate with governance and engineering teams.
Manage multiple concurrent projects using automation and custom flows.
Common Roles
Data Architects
Distinguished Engineers
Pain Points
Repetitive data entry across fragmented tools.
Approval bottlenecks and unclear prerequisites.
Difficulty maintaining consistency across dozens of projects.
PROCESS
Discovery & ALIGNMENT
Activities
Partnered with the VP of Architecture, Governance Director, Product Head, and Technical Writing Lead to define goals and constraints
Reviewed six months of prior UX research on onboarding and provisioning
Conducted four iterative rounds of interviews and group testing with divisional architects
Learning
In-house jargon and unclear prerequisites caused confusion
Lack of process transparency led to delays and rework
Architects needed a single source of truth to manage dozens of concurrent projects
OUTCOMES
Clear articulation of user pain points and mental models
Alignment with the need for a unified, transparent provisioning flow
IDENTIFIED POINTS FOR IMPROVEMENT
Needed to simplify language and clarify expectations
Required embedded documentation and Q&A to reduce reliance on external calls
design & validation
Activities
Delivered polished mockups using the Data Portal design system
Co-led a service-blueprint workshop mapping frontstage, backstage, and support flows
Validated mockups through rapid user interviews and stakeholder reviews
Leveraged AI to decode terminology, refine form copy, and recommend new Documentation Center pages
Learning
Automated pipelines could eliminate manual handoffs and accelerate approvals
Live dashboards surfaced bottlenecks in real time
Embedded Q&A hubs and proactive notifications reduced abandonment and improved satisfaction
OUTCOMES
Automated pipelines cut approval time by 2 days
Live dashboards reduced total cycle time by 5 days
Proactive notifications boosted satisfaction by 7 points
Audit trails and structured rejection comments improved governance coverage
IDENTIFIED POINTS FOR IMPROVEMENT
Needed to expand automation to the application and user onboarding
Required ongoing refinement of dashboards and SME routing to reduce SLA breaches further
key Metrics
Objectives
Cut total provisioning cycle time
Improve user satisfaction and reduce form abandonment
Increase governance coverage and auditability
Reduce SLA breaches and approval delays
Key Metrics
Total cycle time reduced from 15 → 10 business days.
Architecture approval time reduced from 7 → 5 business days.
SLA breach rate reduced from 18% → 14%.
User satisfaction score increased from 68% → 75%.
Form abandonment rate reduced from 22% → 19%.
Audit trail coverage increased from 45% → 80%.
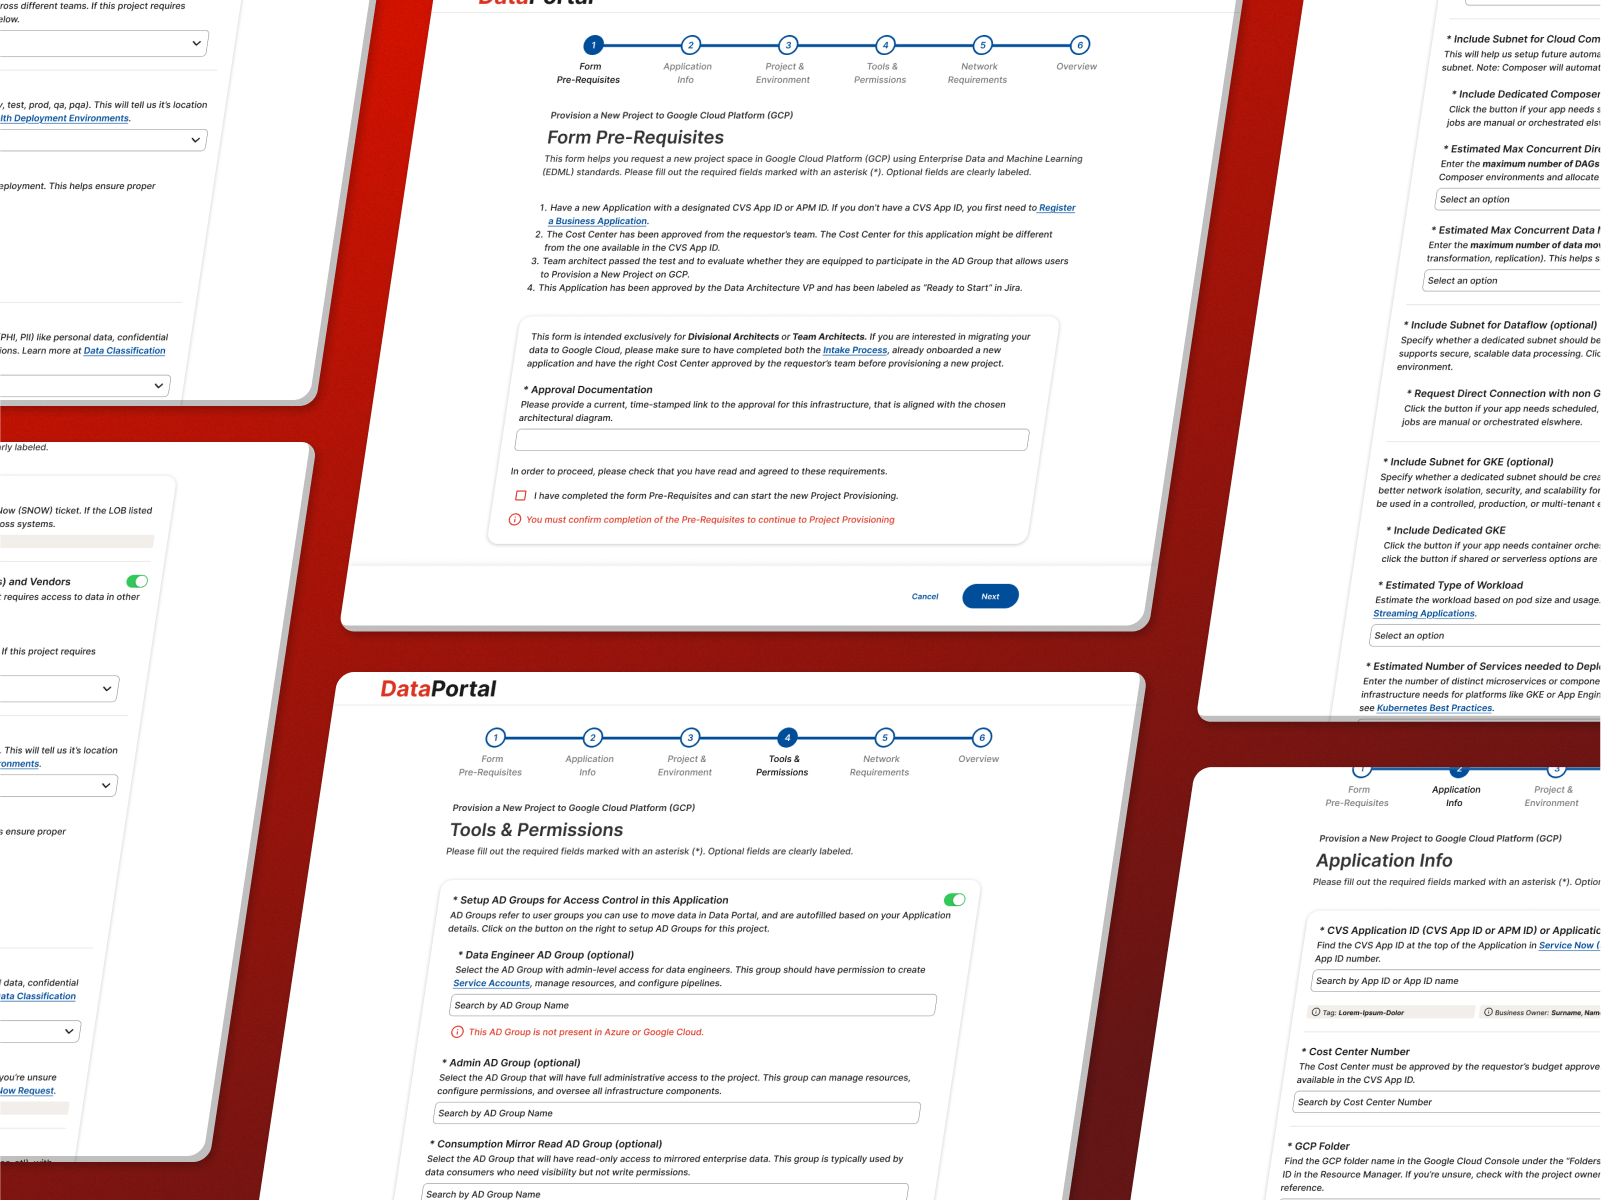
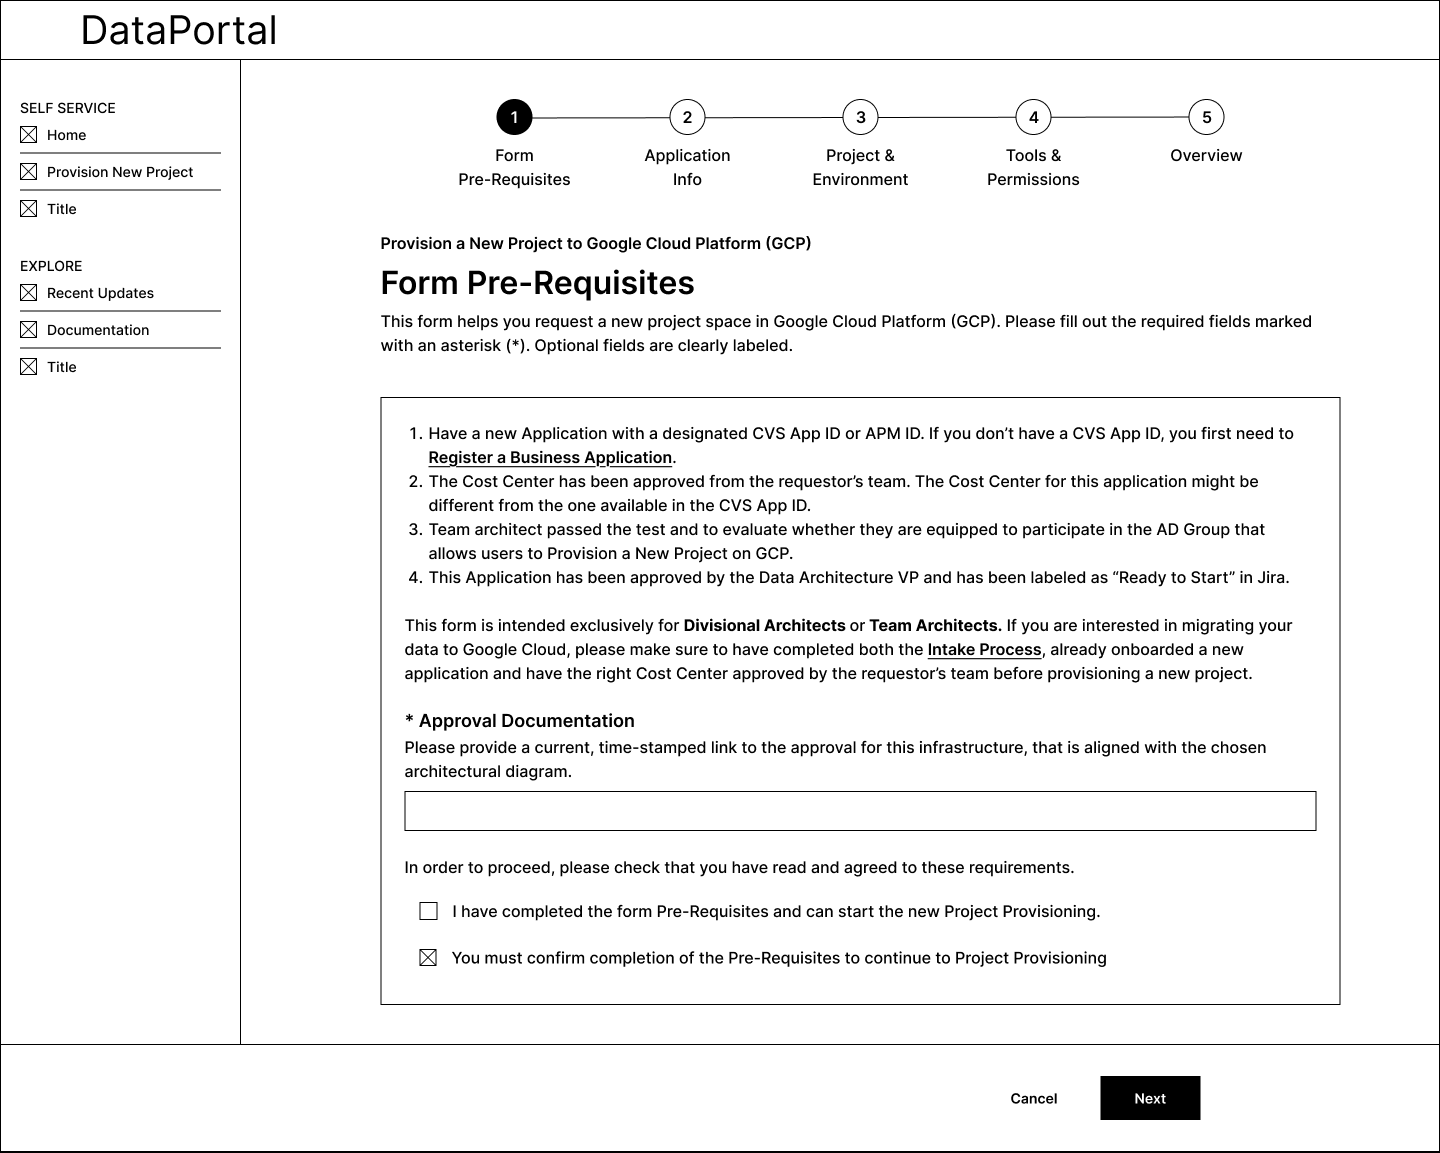
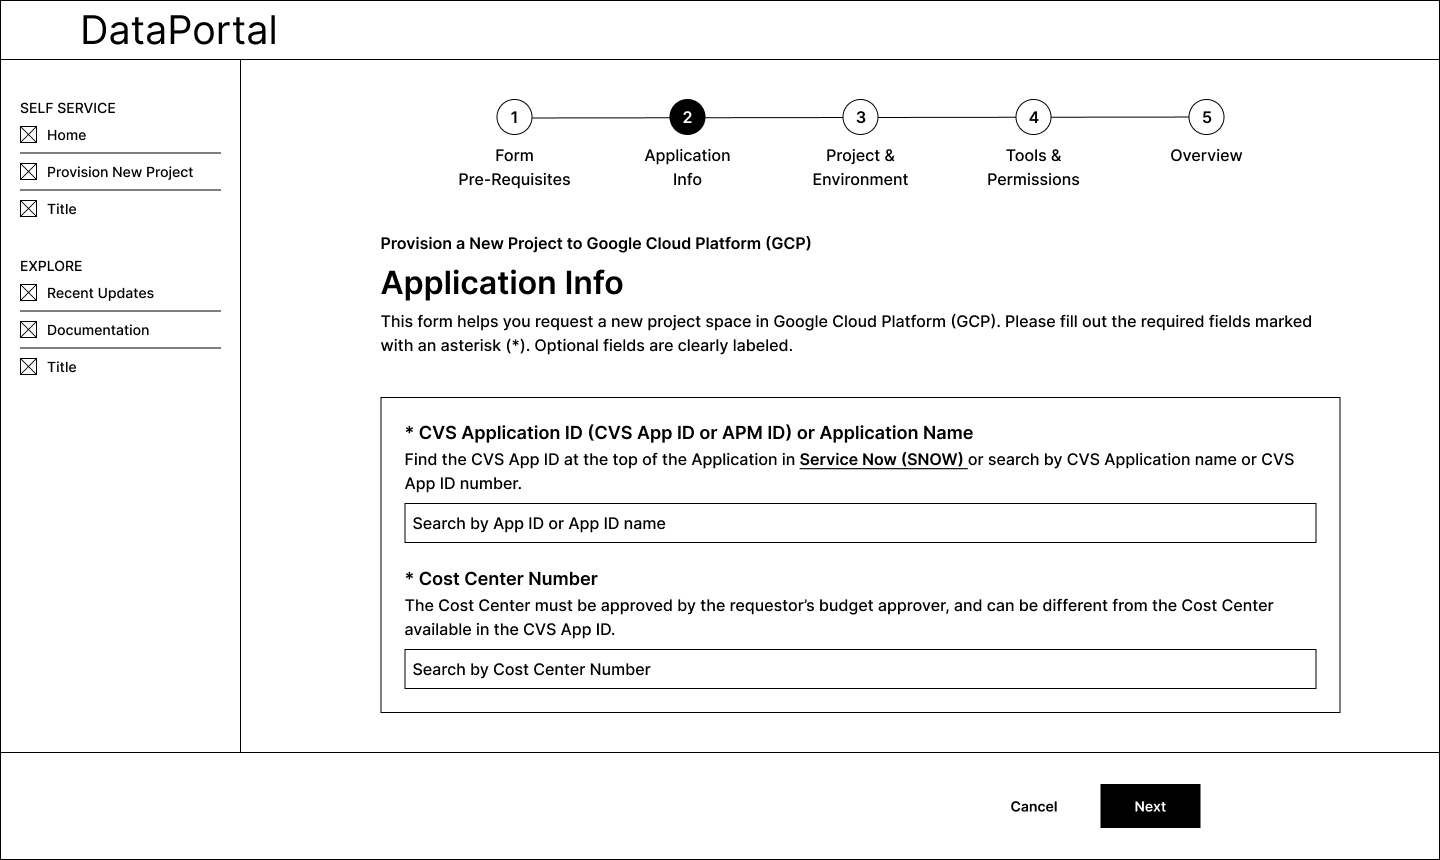
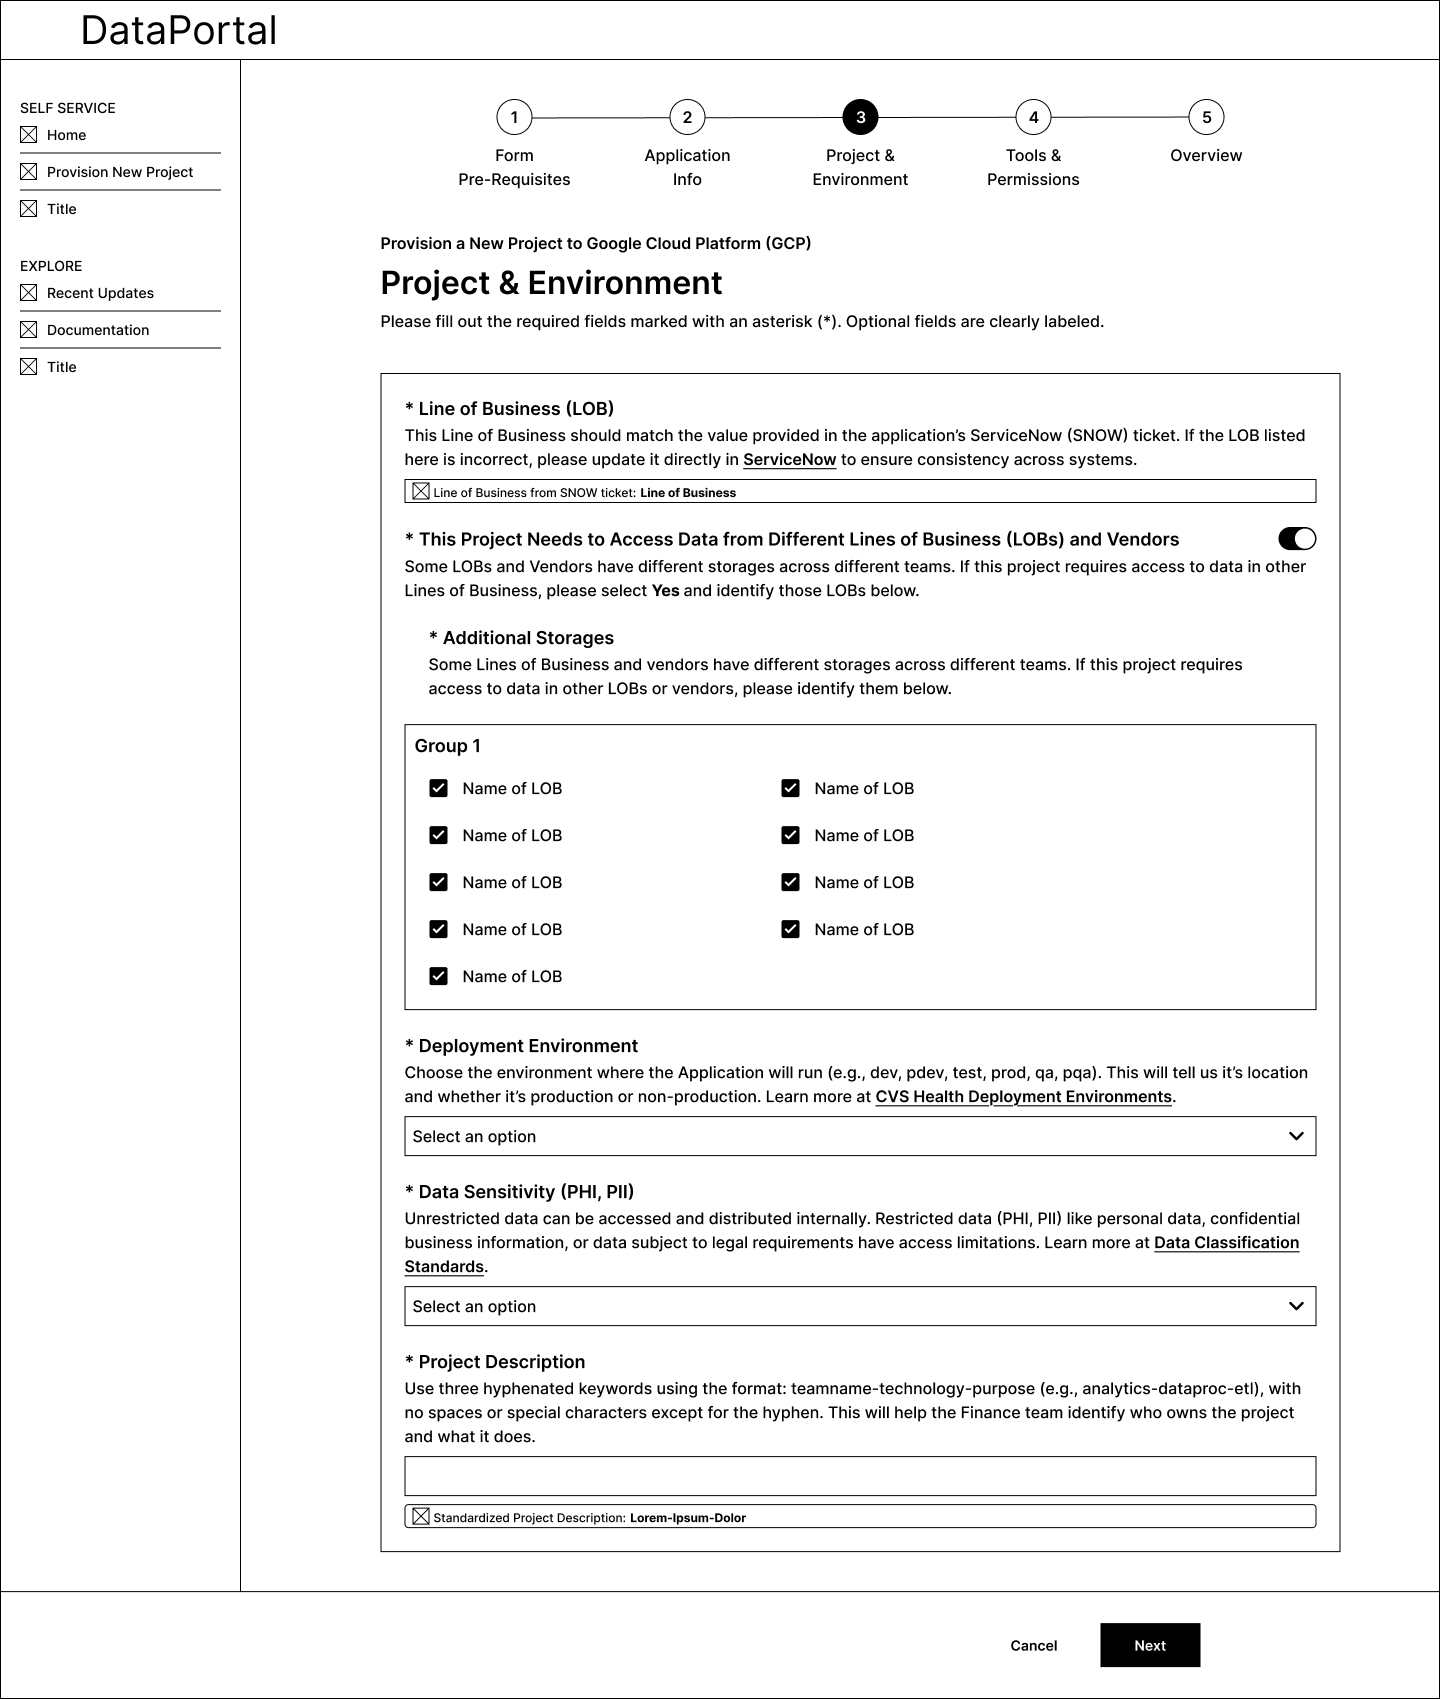
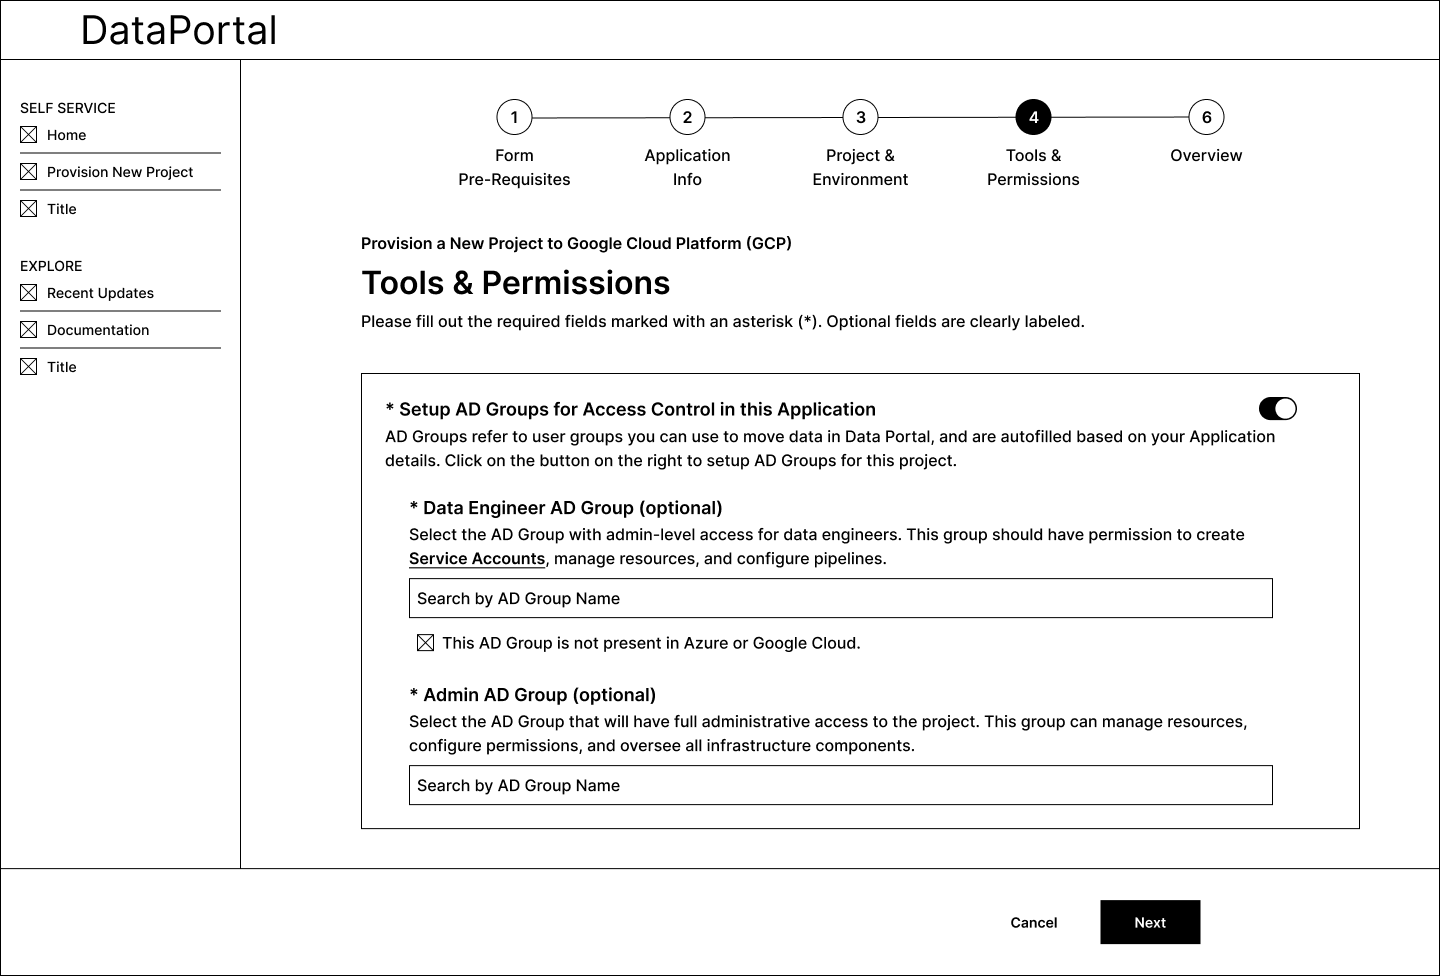
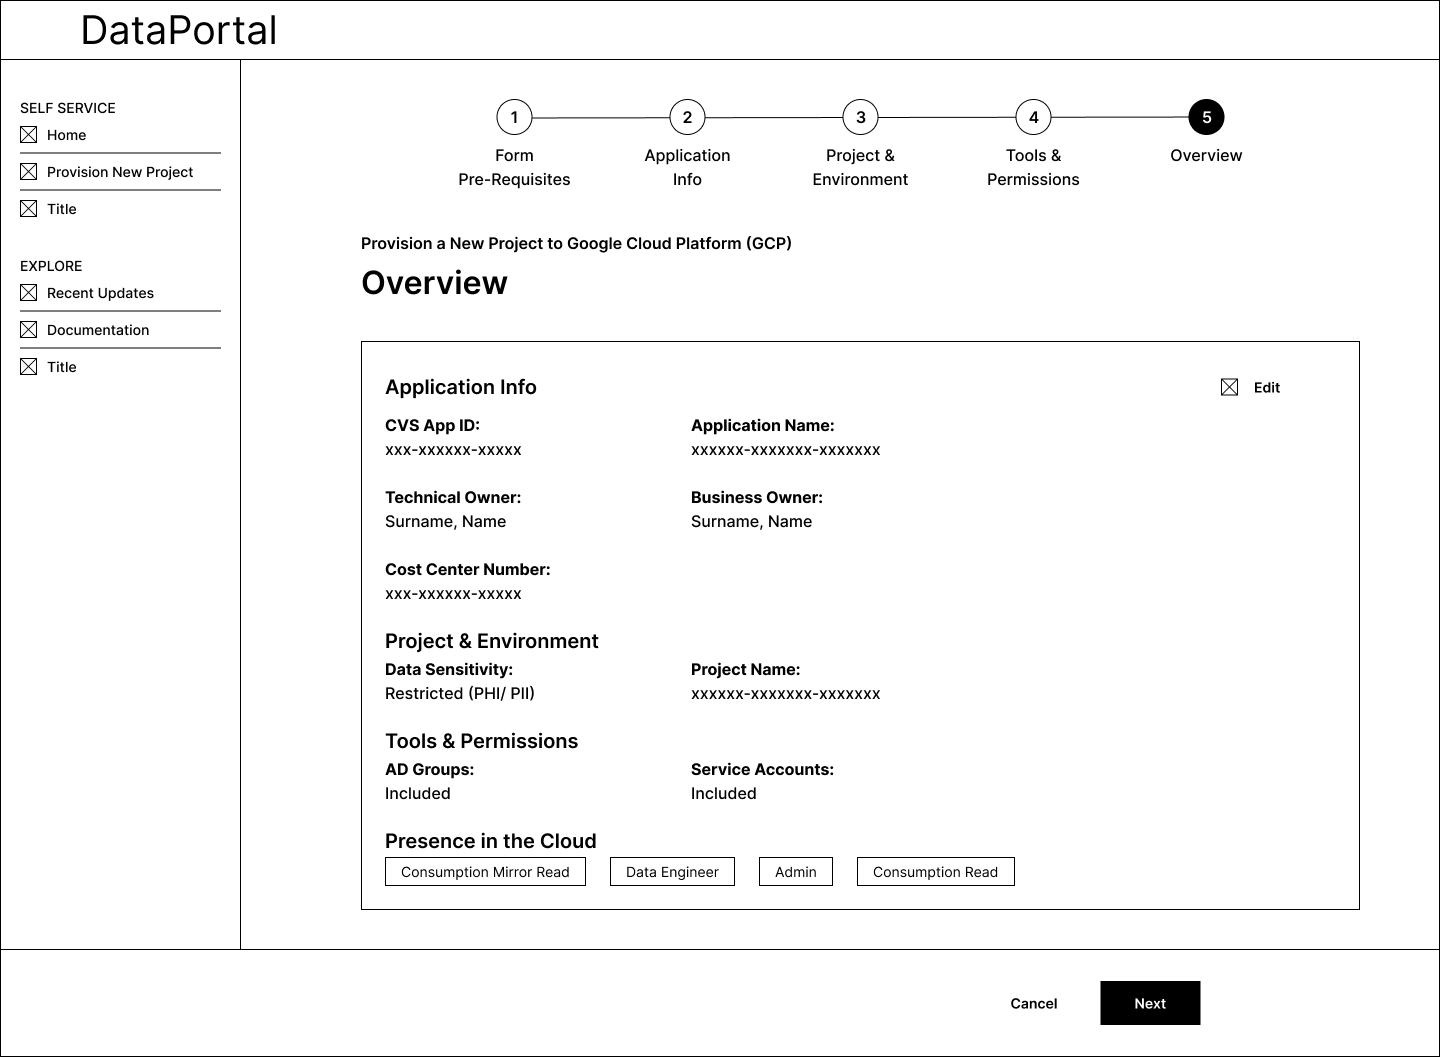
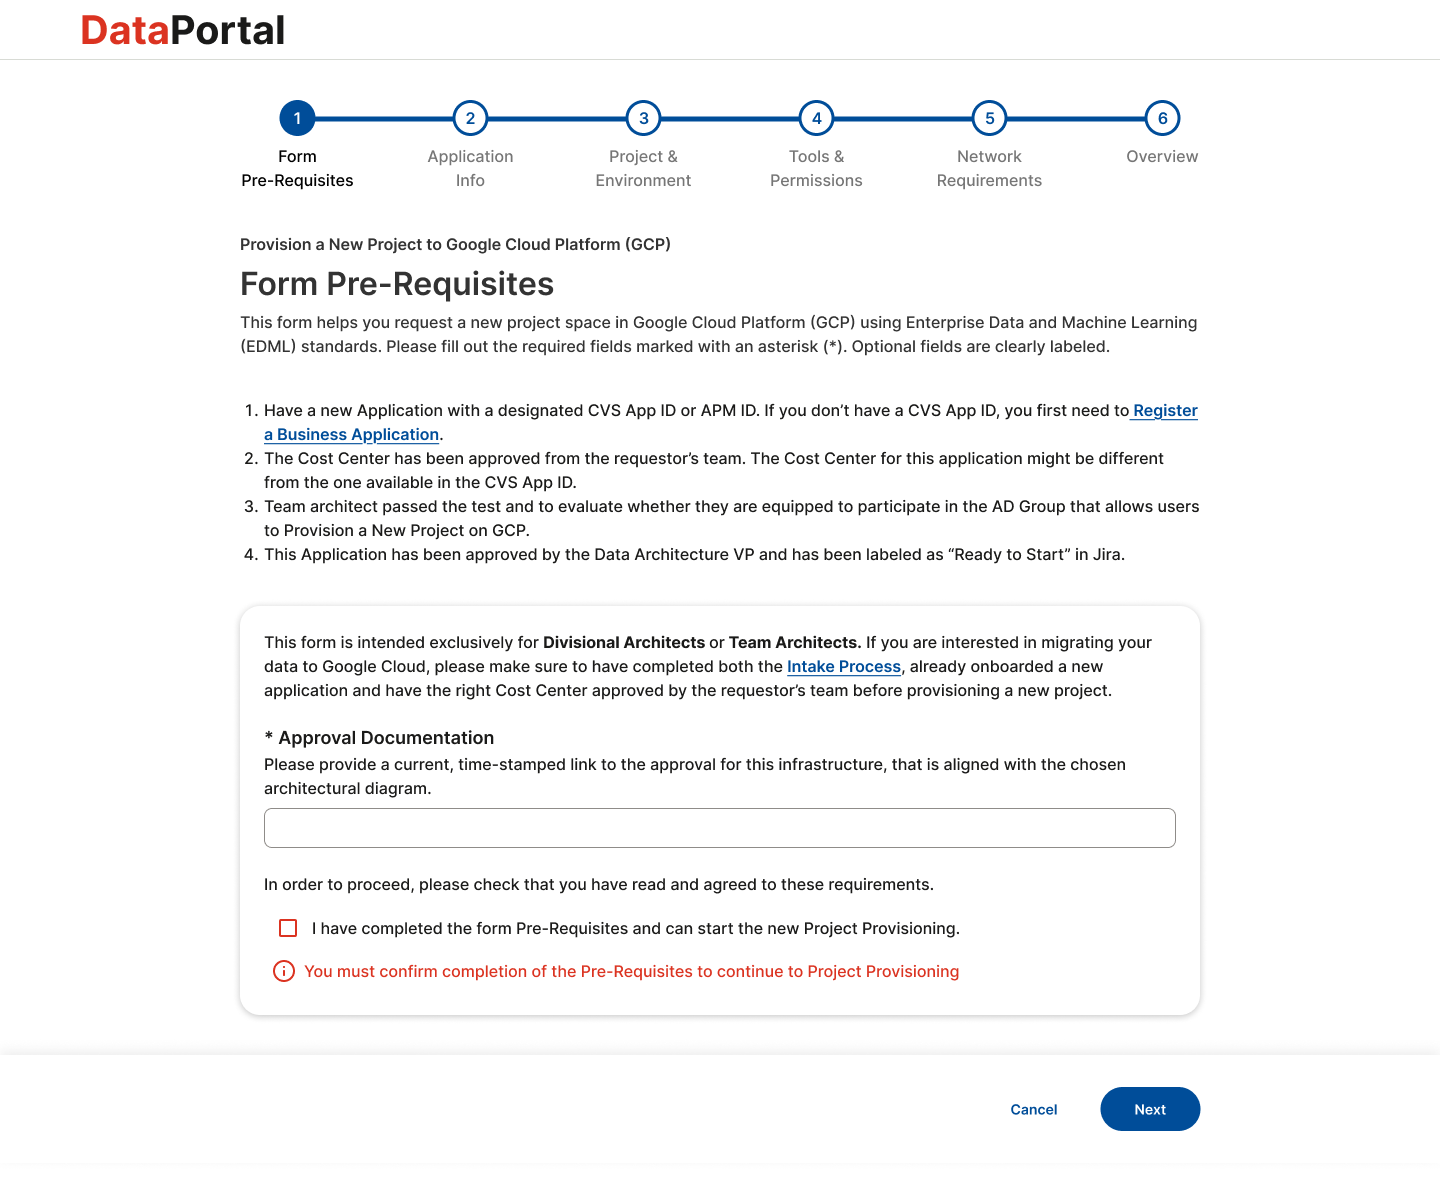
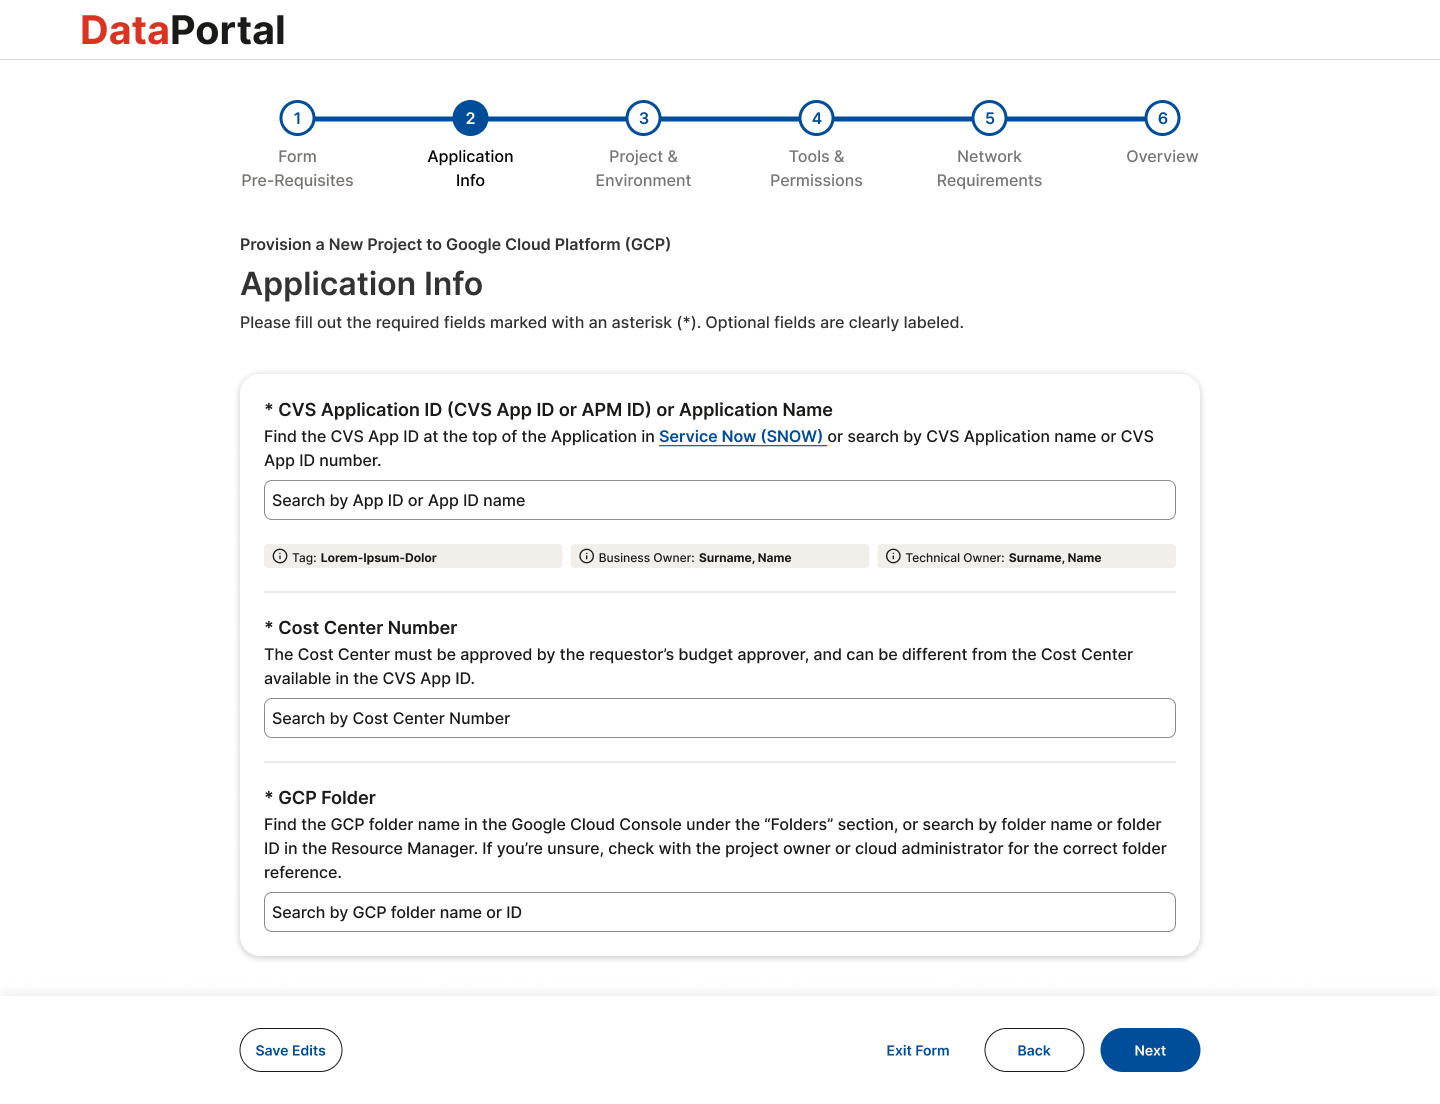
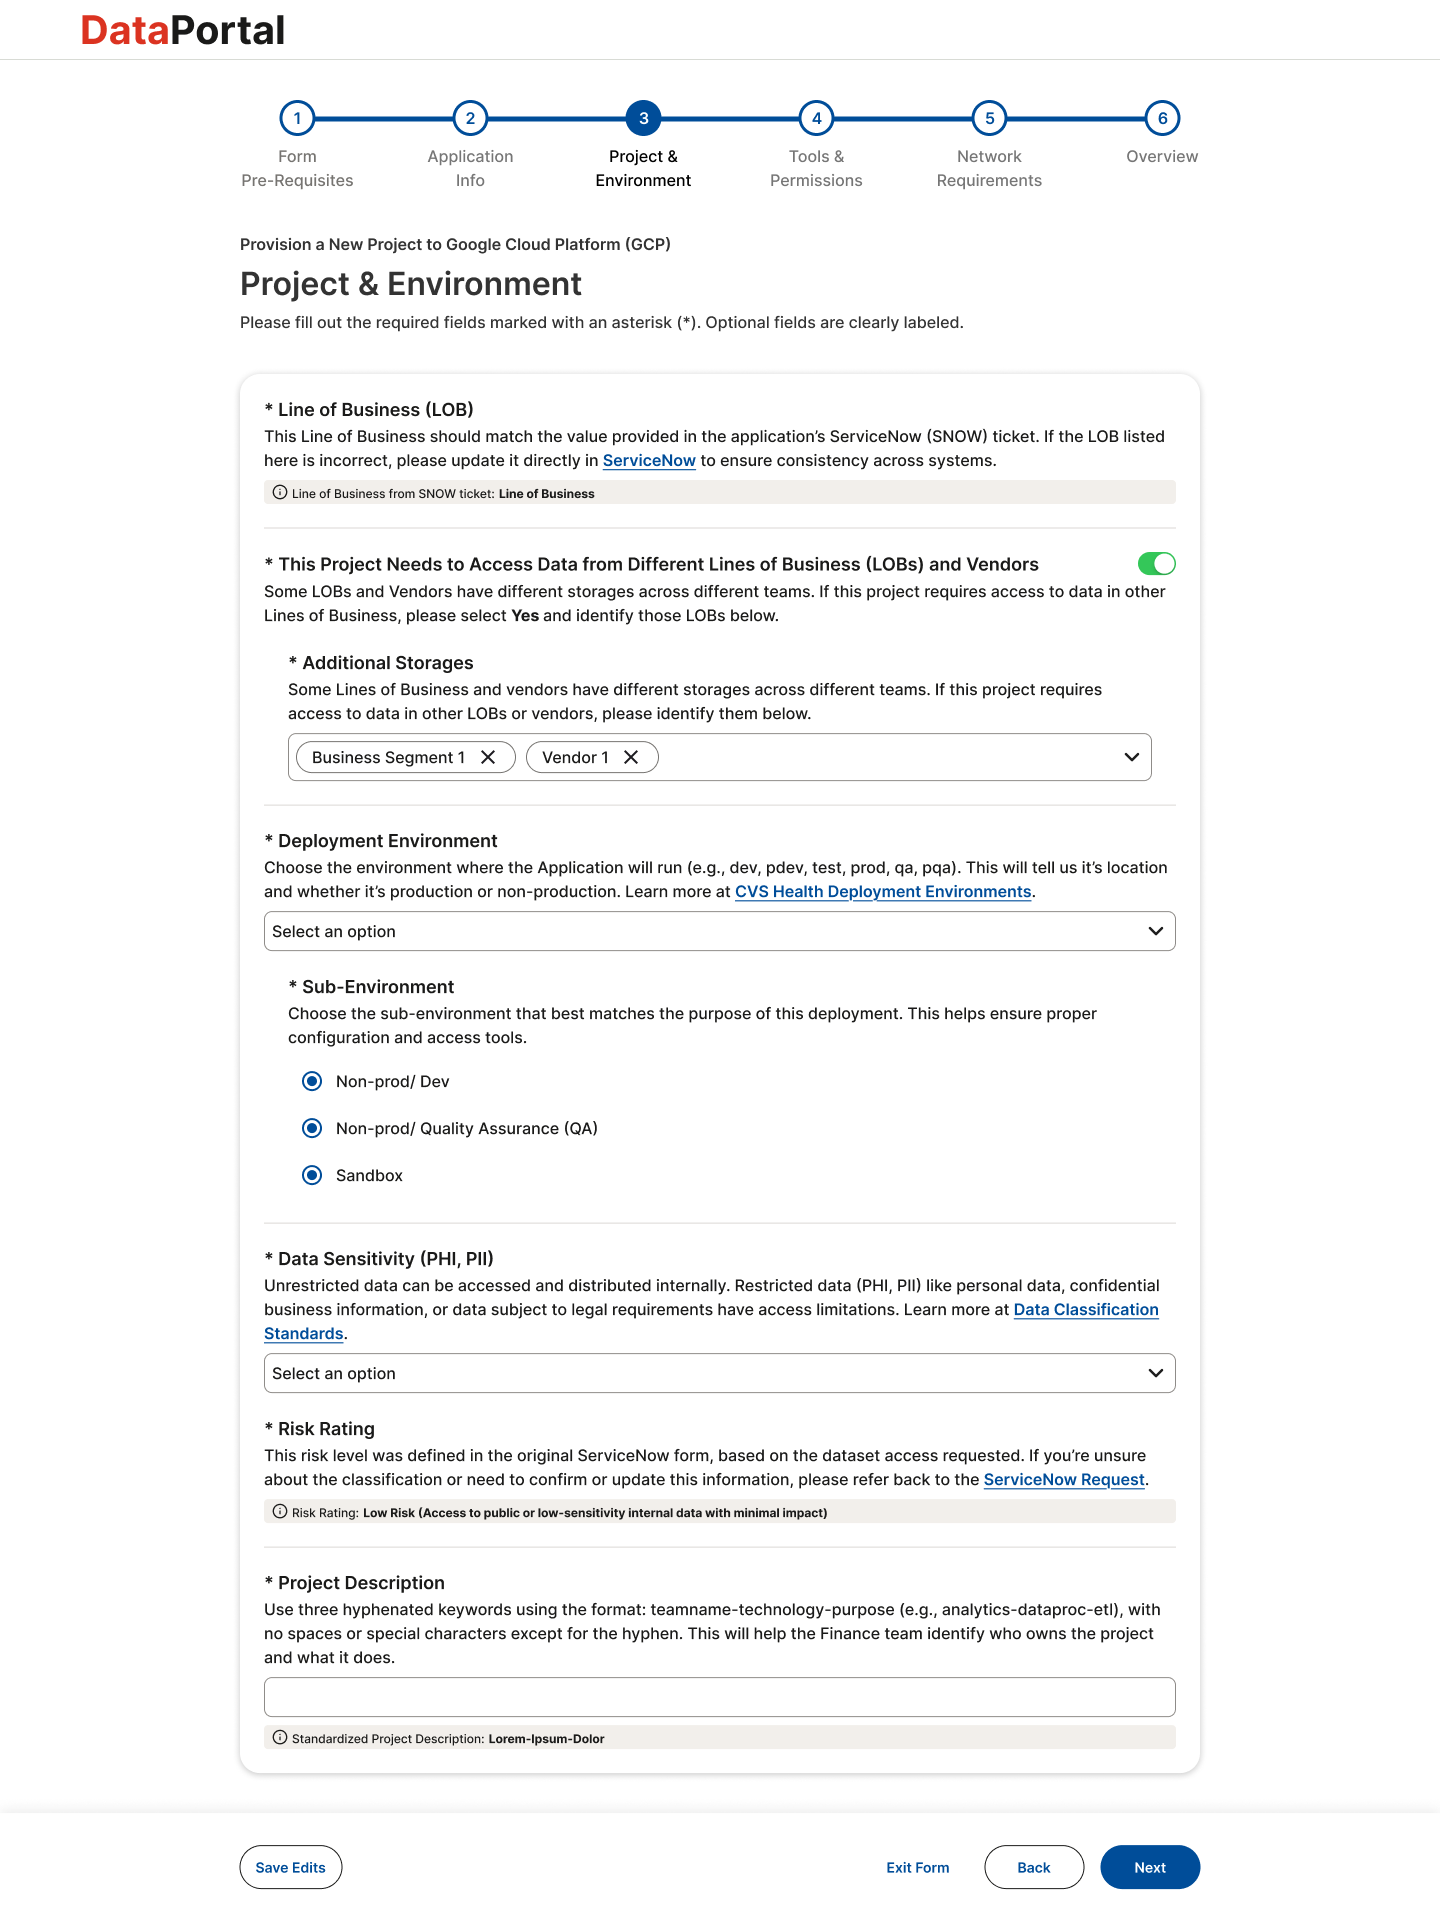
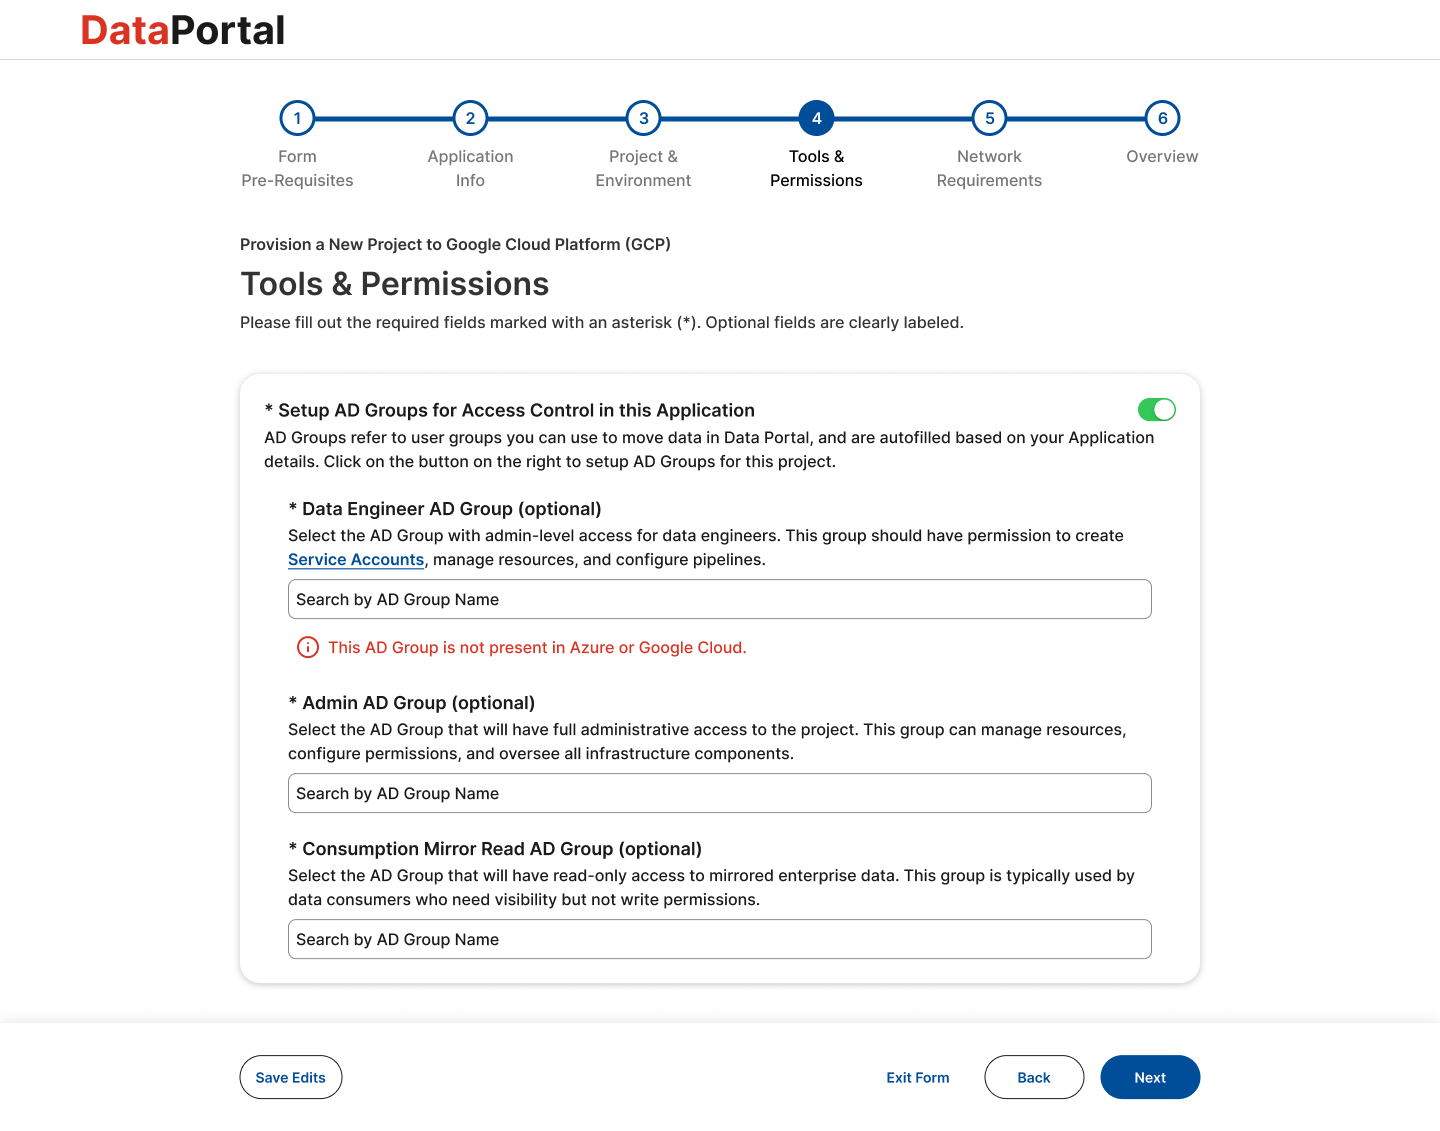
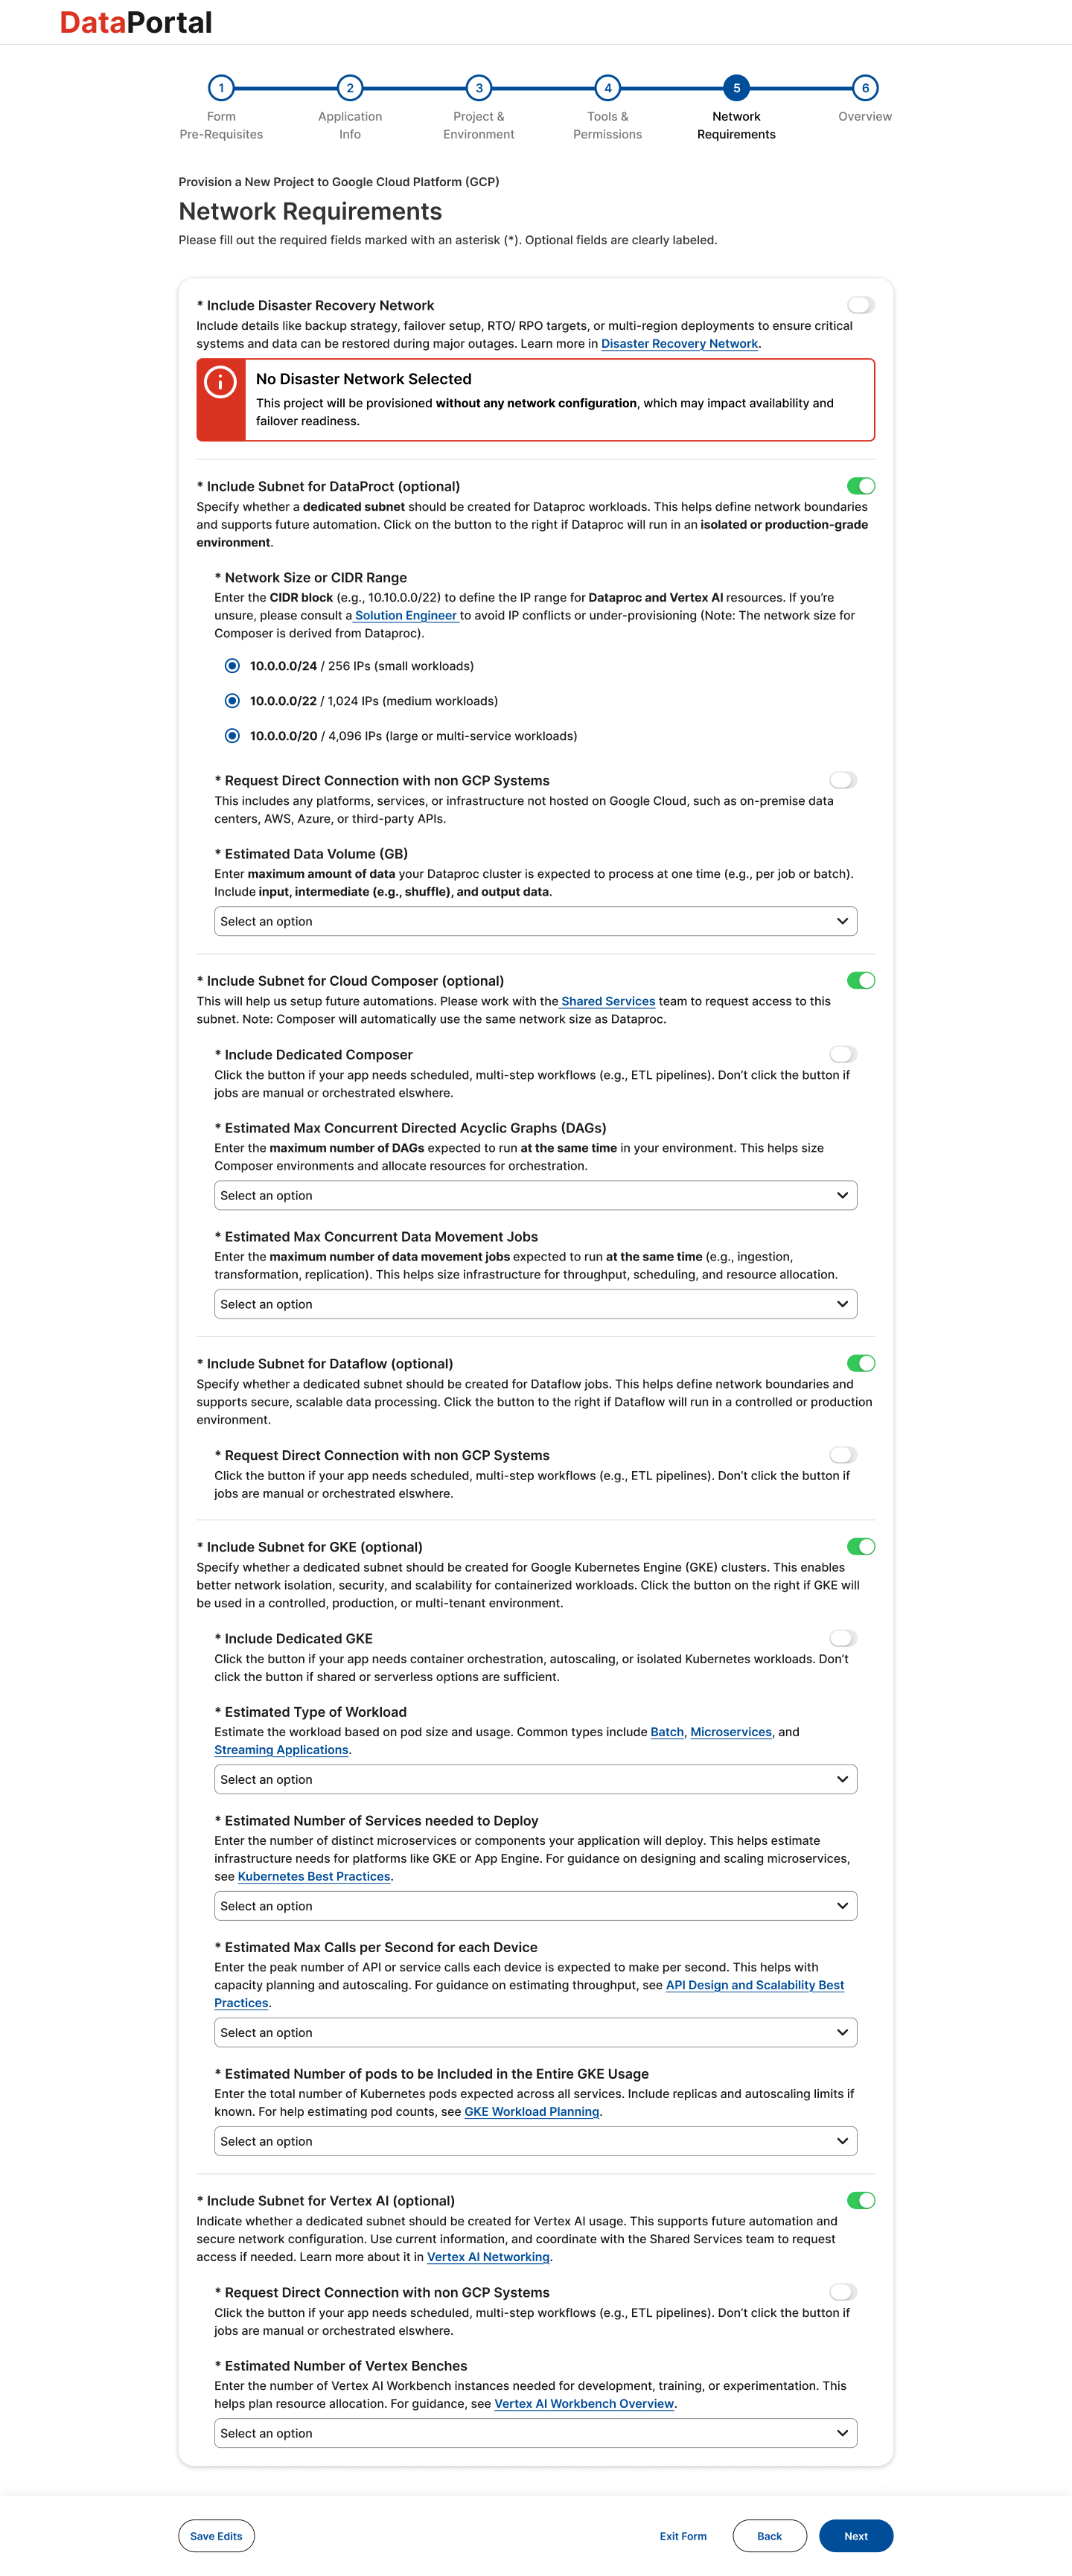
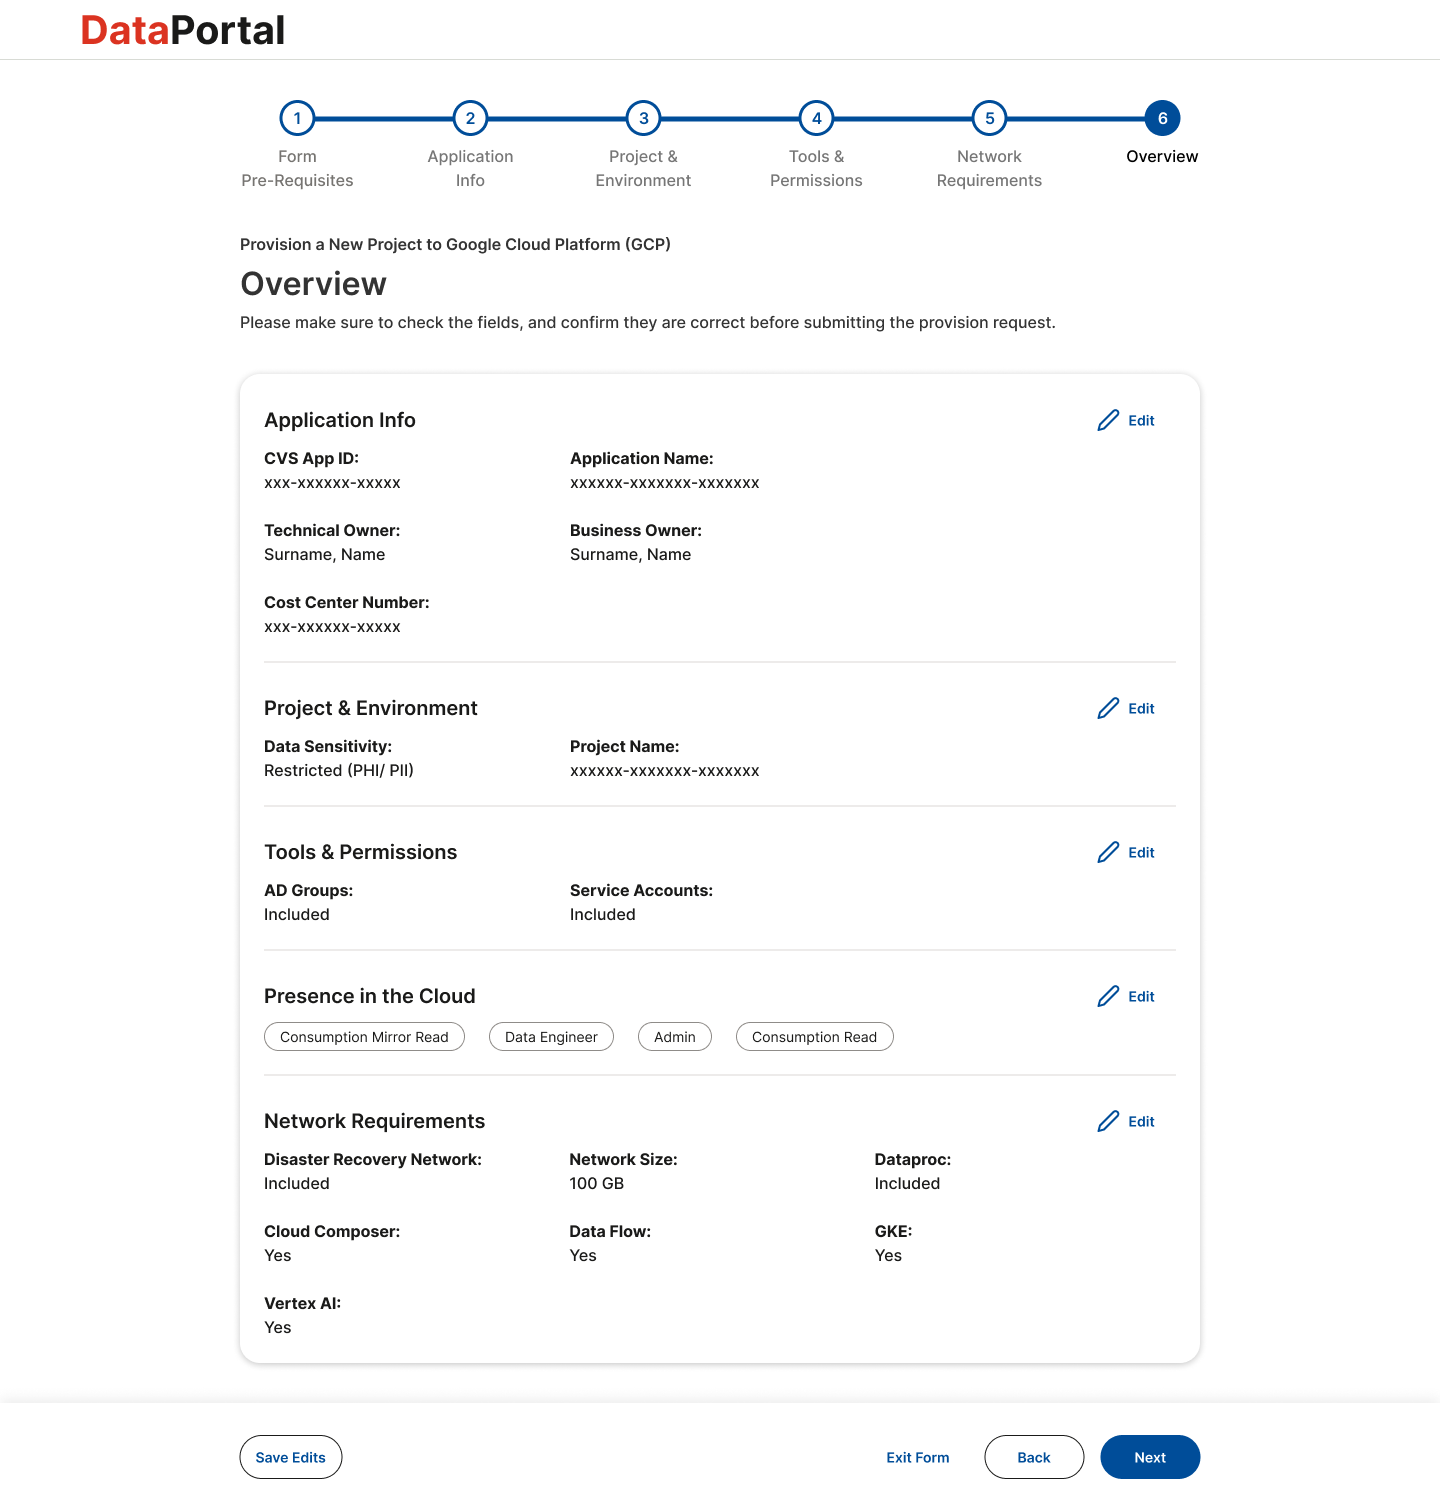
outputs
High-fidelity mockups of unified provisioning flow
Service blueprint mapping frontstage, backstage, and support processes
Embedded Q&A hub and proactive notification system
Automated pipelines, live dashboards, and lineage-based SME routing
Governance artifacts: audit trails and structured rejection comments
Thank you for your time.