Data Quality management
overview
Roles
Lead UX Researcher
Workshop Facilitator
Product Manager
Tools
Miro & Miro AI
Confluence
Jira
Copilot
Company
CVS Health
Duration
3 months,
Oct 24 - Jan 25
problem
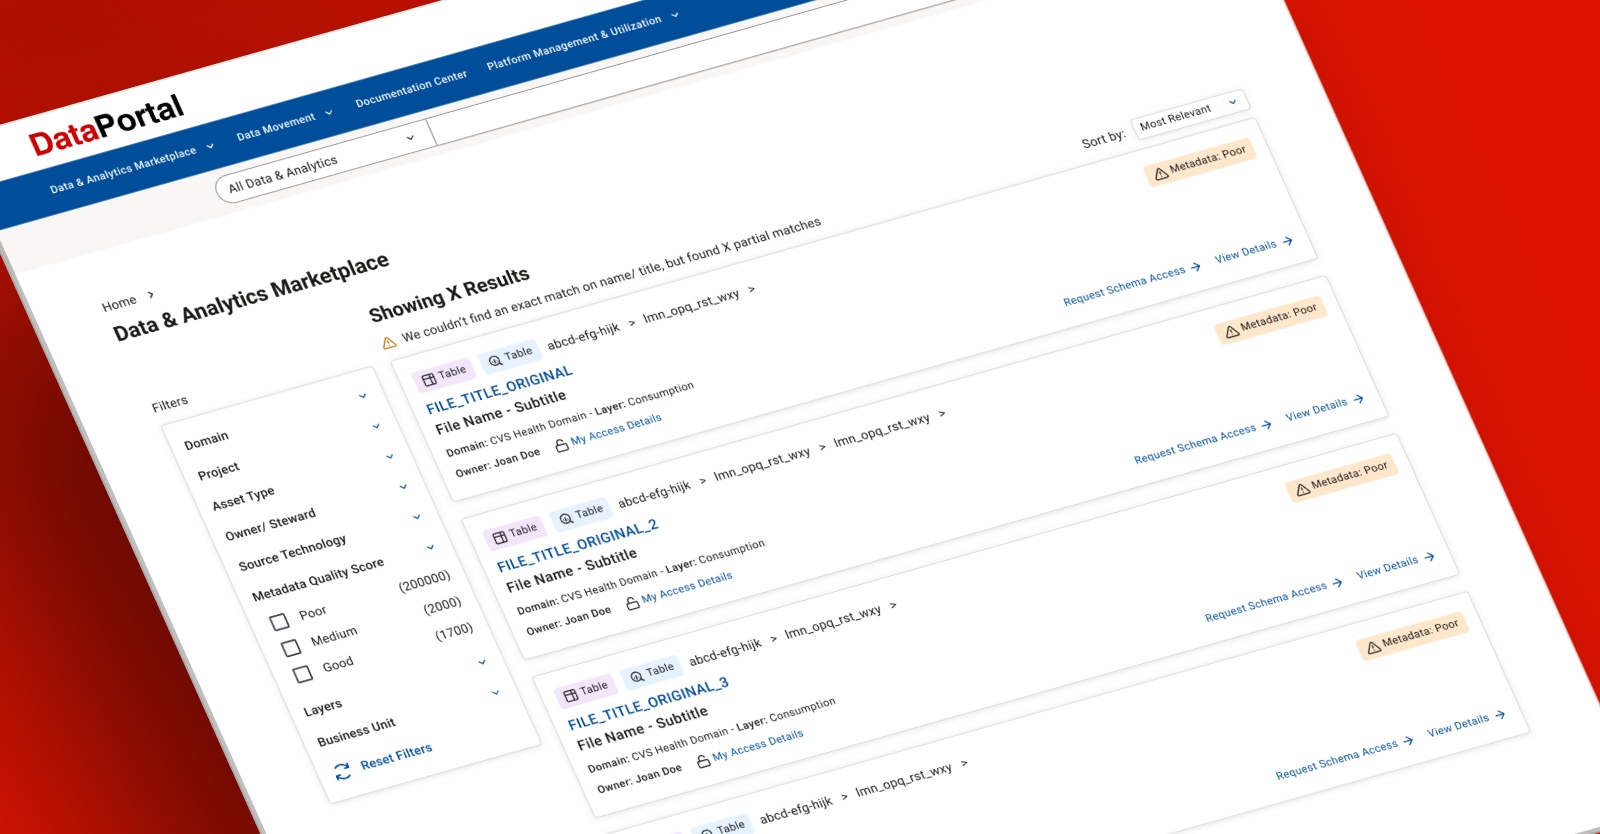
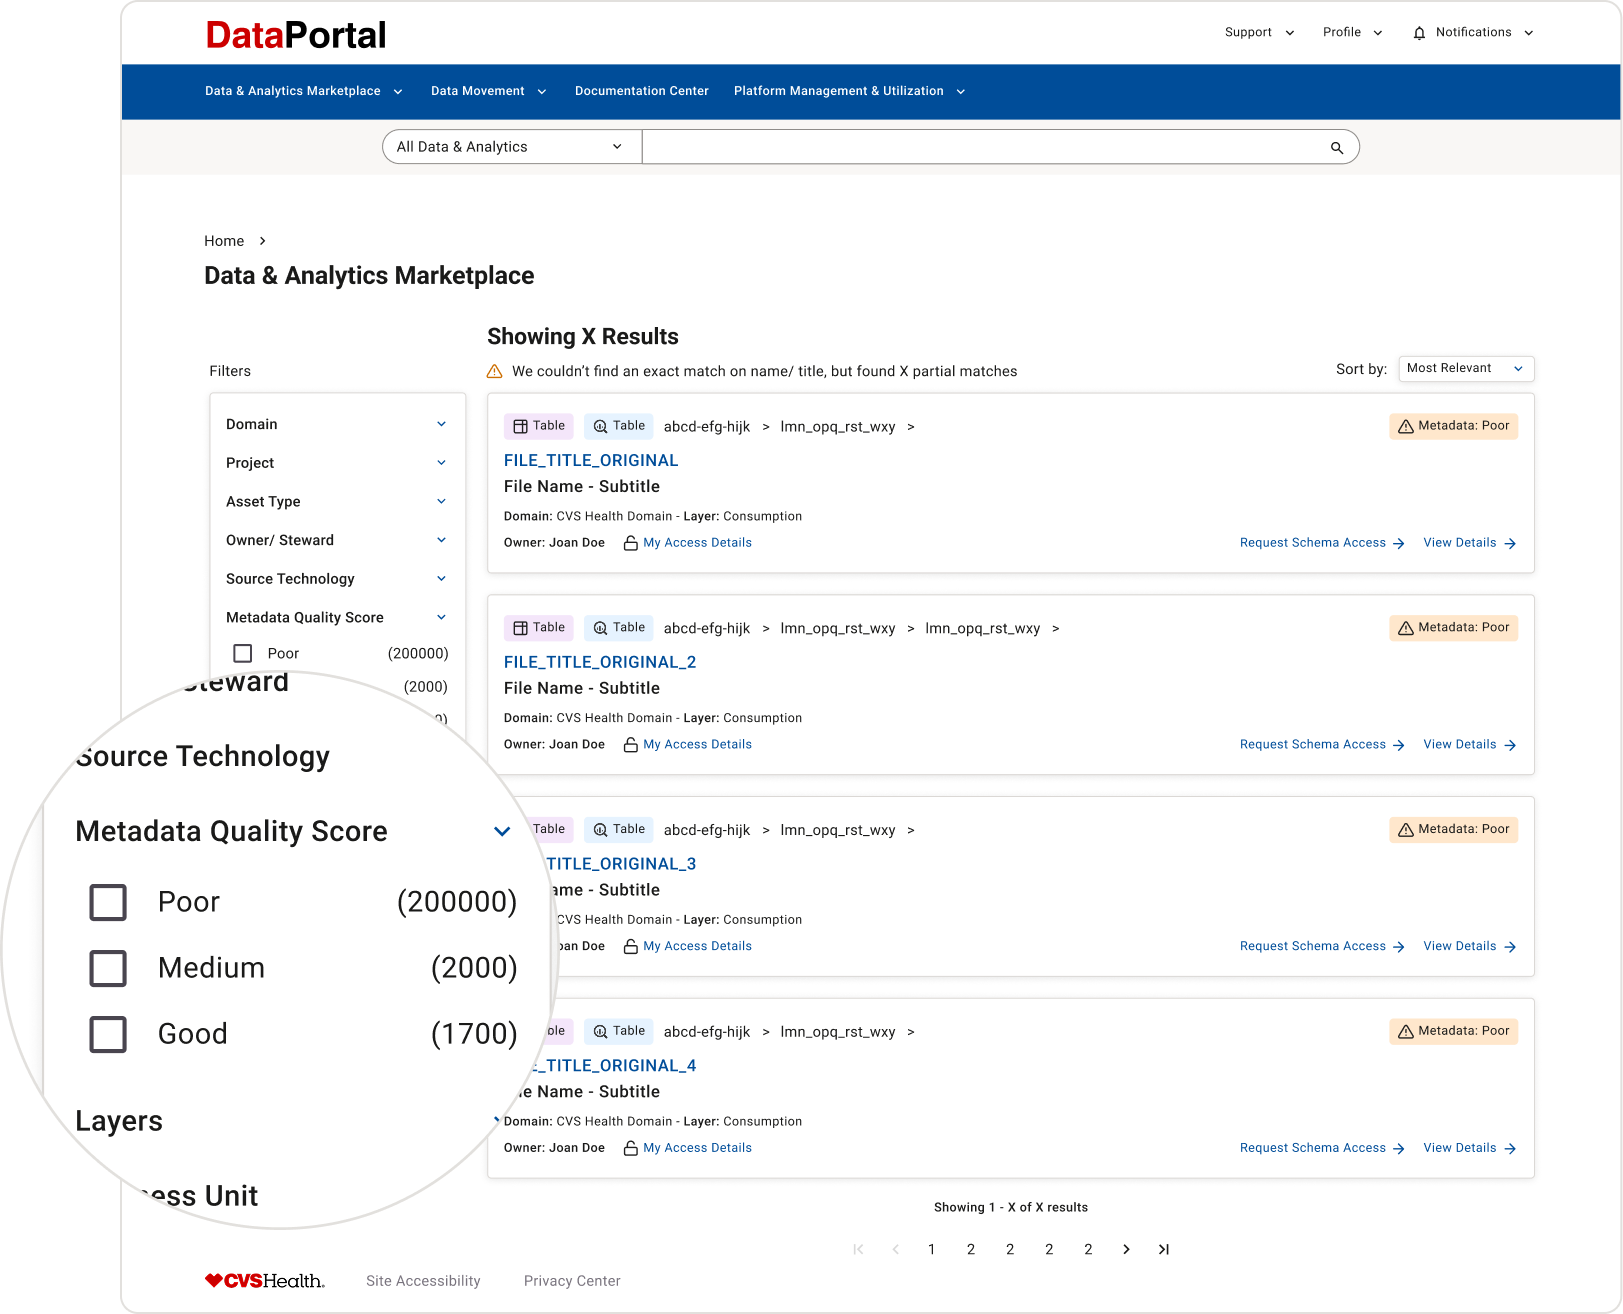
As CVS Health’s data teams expanded, data owners faced outdated, manual, and fragmented processes for maintaining data quality. They struggled to locate information, identify responsible contacts, and ensure secure handling of sensitive data.
The lack of visibility into lineage and failed checks meant that consumers often discovered issues before owners did. Workarounds for encryption and inconsistent metadata practices introduced both security risks and governance gaps.
Over time, these challenges eroded trust in the enterprise’s data assets, creating a perception that the platform was inefficient and unreliable.
goal
Enable business data owners to confidently manage and improve the quality of their data by:
Identifying the day-to-day experiences, pain points, and unmet needs of data owners
Establishing clear ownership, lineage visibility, and proactive alerting mechanisms
Reducing reliance on manual processes and reactive firefighting
Aligning stakeholders around user-driven priorities through collaborative workshops and research artifacts
OUTCOME
This three-month initiative delivered a measurable shift in how data owners managed quality. By grounding priorities in user research and collaborative workshops, the project:
Reduced resolution times and improved proactive monitoring
Increased adoption of underused tools through templates and workflows
Strengthened governance by clarifying ownership and lineage
Restored trust in enterprise data assets, enabling teams to make faster, more confident decisions
user
BUSINESS DATA OWNERS
Common Roles: Business Leaders & Directors
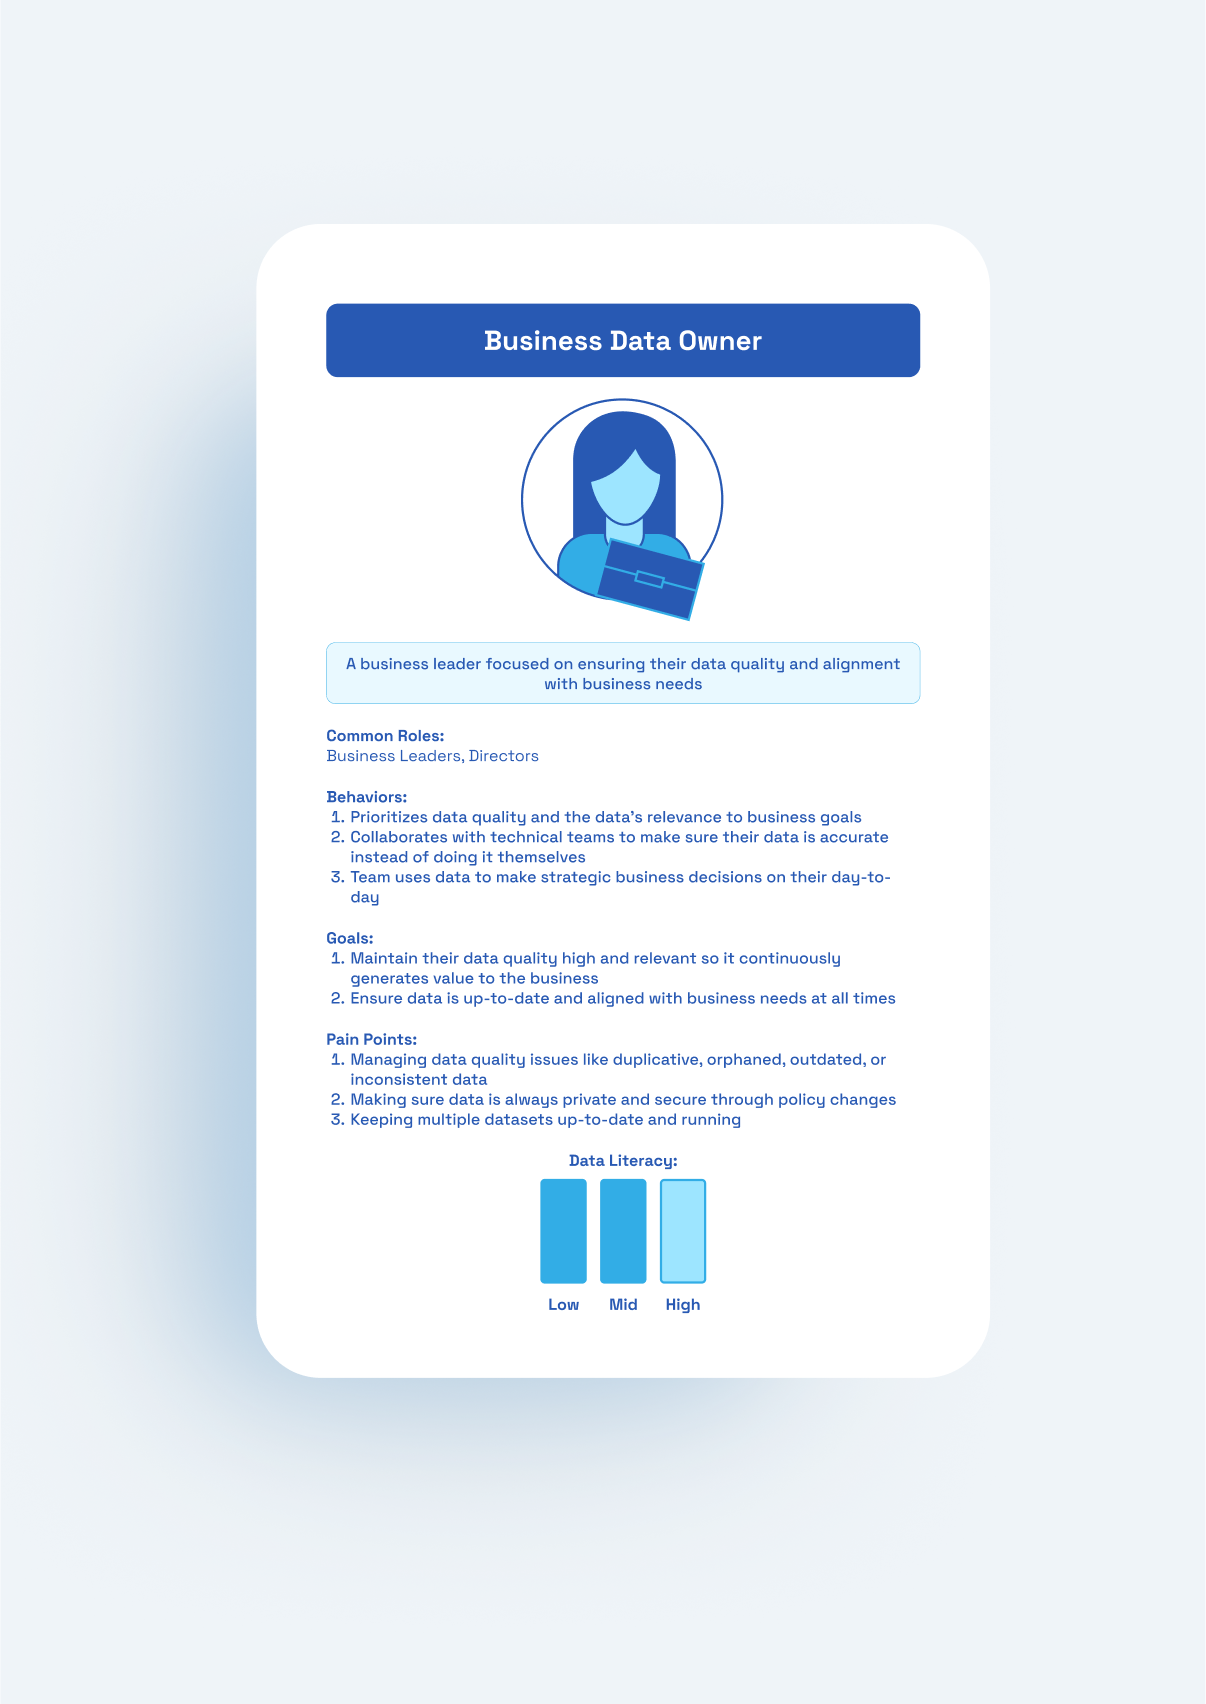
Data Literacy: Medium (on a scale Low-Medium-High)
Pain Points
No visibility into lineage or failed checks
Difficulty finding documentation or responsible SMEs
Reactive firefighting due to a lack of proactive alerts
Security risks from inconsistent encryption practices
Goals
Maintain high-quality, relevant data aligned with business needs
Detect and resolve issues before consumers
Ensure compliance and security without excessive manual overhead
Behaviors
Collaborate with technical teams rather than fixing the asset themselves
Prioritize data quality as a driver of business decision-making
Balance governance requirements with operational efficiency
PROCESS
Discovery & Hypothesis Framing
Activities
Facilitated remote workshops with stakeholders using Lean UX Canvas, RACI charts, and Google’s HEART metrics
Conducted 10 user interviews and shadowing sessions with business data owners
Leveraged AI to draft interview scripts, brainstorm metrics, and consolidate findings
Learning
Owners were lacking visibility into lineage and failed checks
Documentation was outdated or inaccessible
Owners cared deeply about data quality but lacked time and tools to address issues
OUTCOMES
Established alignment on user-driven priorities
Three hypotheses validated
Users lacked real-time tracking of their own assets
Lineage visibility had been absent since the downing of our last tool
There was a delay in issue detection for owners - their consumers detected them first
IDENTIFIED POINTS FOR IMPROVEMENT
Needed clearer standards for metadata and column naming
Required proactive alerting to shift owners from reactive to preventive workflows
journey mapping & prioritization
Activities
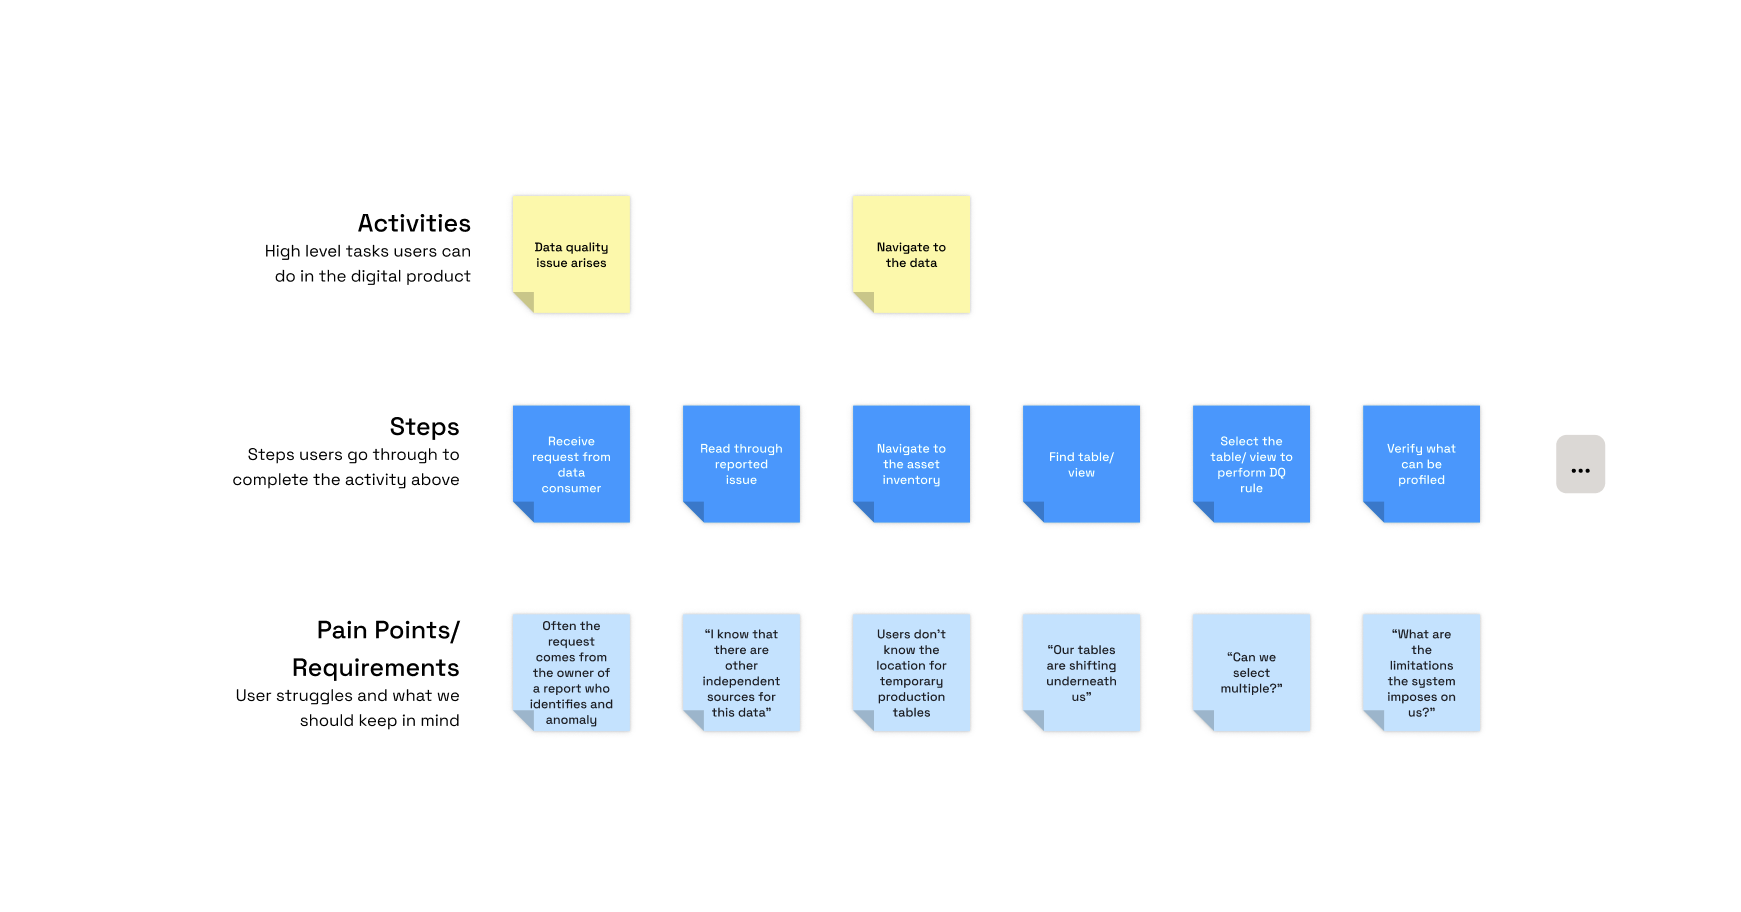
Created proto-journey maps of current-state experiences
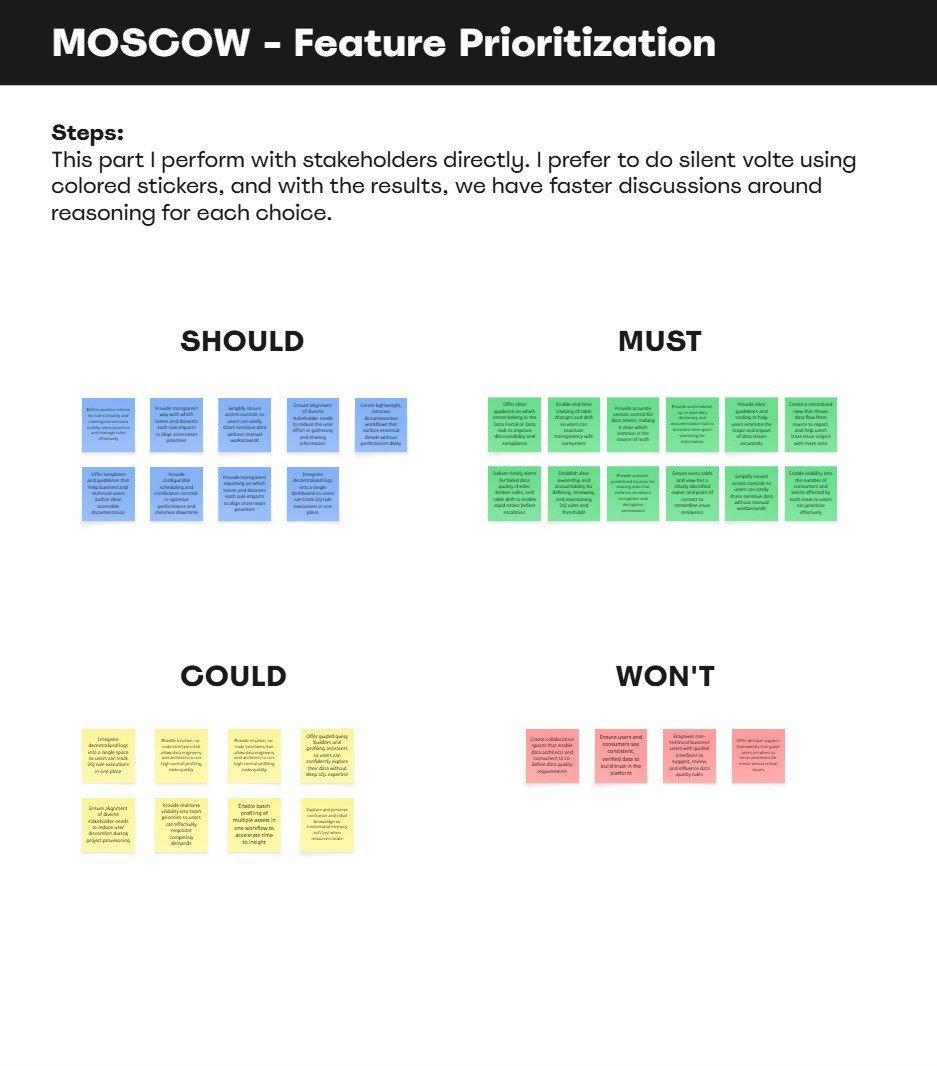
Facilitated a two-part prioritization workshop using the MoSCoW method
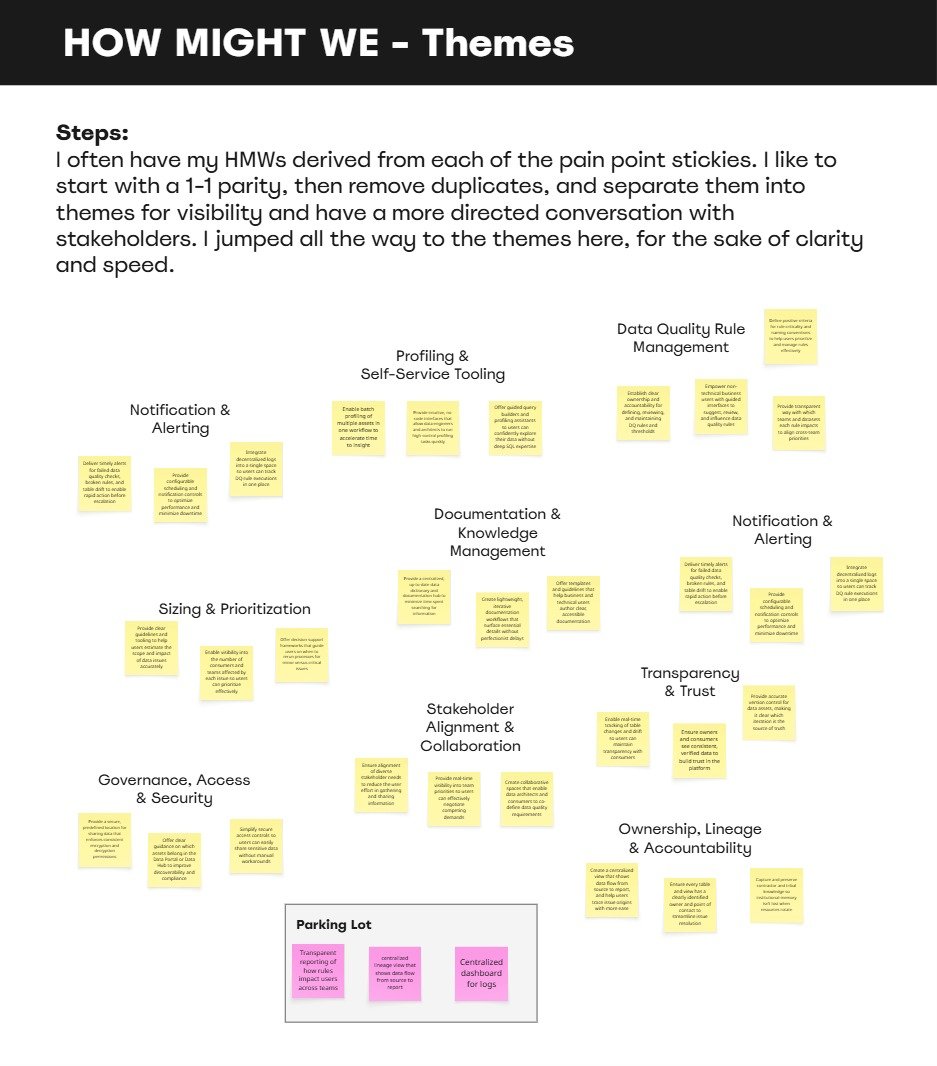
Synthesized patterns from sticky-note clustering and AI-assisted theme sorting
Learning
Data owners were not the ones fixing data; entry-level engineers and contractors handled most issues
Owners were overwhelmed by constant pings and lacked visibility into issues before consumers
Security risks emerged from ad-hoc encryption workarounds
OUTCOMES
Prioritized features: proactive alerting, lineage visualization, SME routing, and metadata validation
Established a shared understanding of user pain points across governance, product, and design
IDENTIFIED POINTS FOR IMPROVEMENT
Needed to automate the integration of governance policies directly into workflows
We also needed scalable solutions to reduce dependency on manual interventions
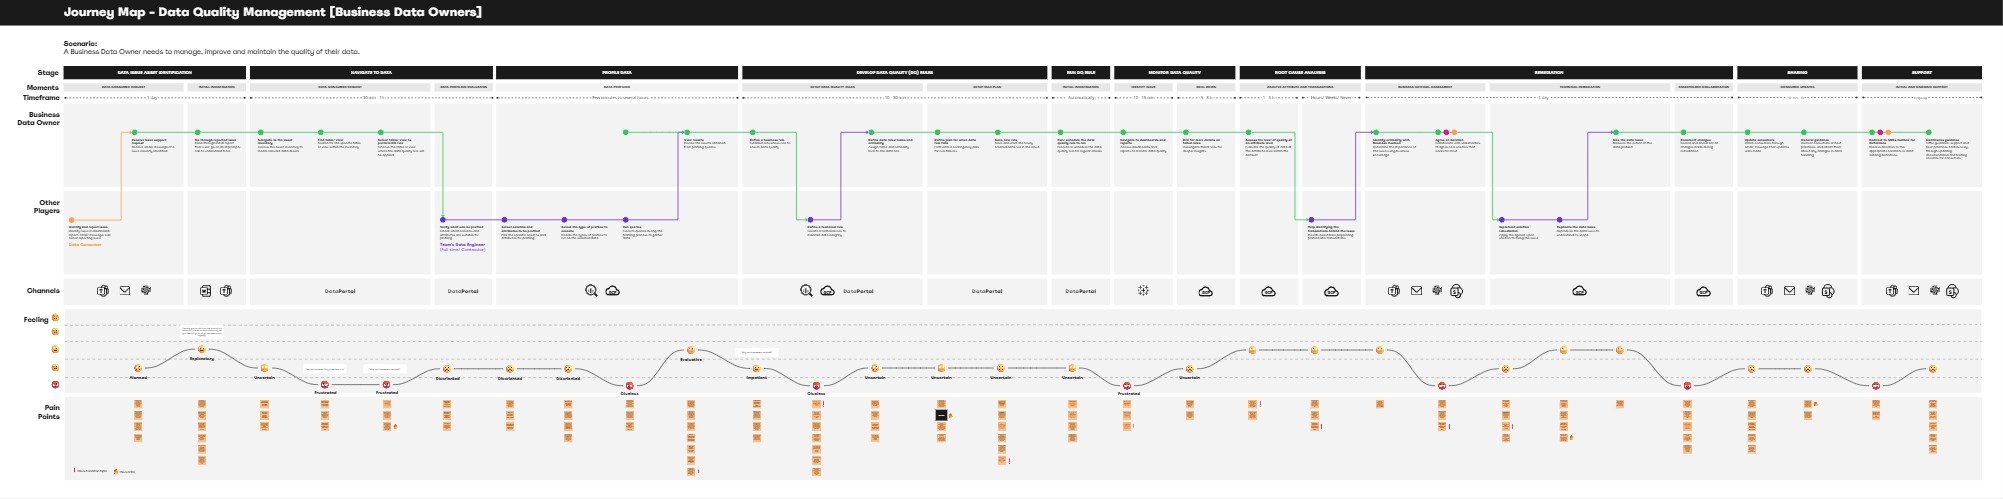
Data Quality Management Journey Map - Click to Access board in Miro
key Metrics
Objectives
Improve visibility into lineage, ownership, and data quality issues
Reduce time-to-resolution for data quality incidents
Increase adoption of metadata quality tools and proactive monitoring
Strengthen trust in enterprise data assets
Key Metrics
Avg. response time to data inquiries reduced from 5 days → 48 hours
Avg. time to resolve data quality issues reduced from 11 days → 6 days
% of tables passing quality checks increased from 62% → 82%
Active usage of metadata quality tools increased from 52% → 62%
Data owner satisfaction score during this period improved from 1.8 → 3.8 out of 5
outputs
Journey maps of current-state and prioritized future-state experiences
Stakeholder alignment artifacts: Lean UX Canvas, RACI chart, HEART metrics
Prioritized backlog of features (proactive alerting, lineage visualization, SME routing)
AI-assisted synthesis reports and workshop documentation
Thank you for your time.