Enterprise data user archetypes
overview
Roles
Lead UX Researcher
Lead Data Visualization Designer
Tools
Miro & Miro AI
Tableau
Copilot
Company
CVS Health
Duration
6 months,
Aug 23 - Feb 24
problem
CVS Health's Enterprise Data Platform and its frontend application, the Data Portal, serve a diverse set of users with varying levels of technical expertise, data literacy, and jobs that revolve around data in their day-to-day. As the platform grew, the absence of a mutual understanding of our users made it challenging to address any of their needs effectively.
The Data Portal was initially built by engineers for engineers. It prioritized features for people with a lot of technical expertise, using language that sometimes required an unreasonably high data literacy skill.
But as a frontend experience and with changes in the perception of data shifting across the enterprise, it became necessary to align stakeholders around a common understanding of not our current, but potentially a much larger user base in the future.
Because this didn’t prioritize the users, it wasn’t working.
goal
The goal of this study was to create an actionable, data-driven, and centralized tool to help our product and Agile teams frame platform problems, opportunities, and features around our users’ goals, needs, and behavior.
Identify our users’ professional goals, their uses of data, roles, hierarchical levels, data literacy skills, data tooling, biggest pain points, and unmet expectations around data in our enterprise.
Identify and take note of patterns based on quantitative and qualitative data collected across surveys, interviews, shadowing, and self-reported experiences.
Based on the identified patterns, produce a synthesized, clear, and actionable tool that allows stakeholders to reduce bias when distinguishing between stakeholder hypotheses vs user experience, as well as having a quick reminder of some of the most important user needs, goals, and behaviors when trying to address their pain points.
OUTCOME
This six-month initiative at CVS Health produced a centralized, data-driven framework of five enterprise user archetypes. It aligned cross-functional teams around shared language and actionable insights, turning to be a crucial facilitator of user-centered enhancements to our data platform.
PROCESS
iteration 1: CONSUMPTION USER SEGMENTS
Oct - Nov 2023
Activities
Interviewed 8 Stakeholders to better understand the study's requirements, scope, metrics, and timeline.
Conducted a Best Practices Audit in the persona frameworks built in the past, including from the Data Architect VP, a Consultant from a large company, the User support team, and the Platform director.
Sent out a Survey targeting our current users with 180 responses, which informed the creation of a multi-layered dashboard with information regarding use for each user group.
Followed up with 10 User Interviews to gather more insight into how they use data in their roles, which tools they used, and what were some of their most pressing needs and pain points around data in our Enterprise.
Learning
User data literacy varies greatly across the enterprise and determines whether people use the Data Portal or not.
Users have a diverse range of capabilities they can use in our data platform, but 88% of them were using solely the marketplace.
Users either consume or produce data; very few users do both.
OUTCOMES
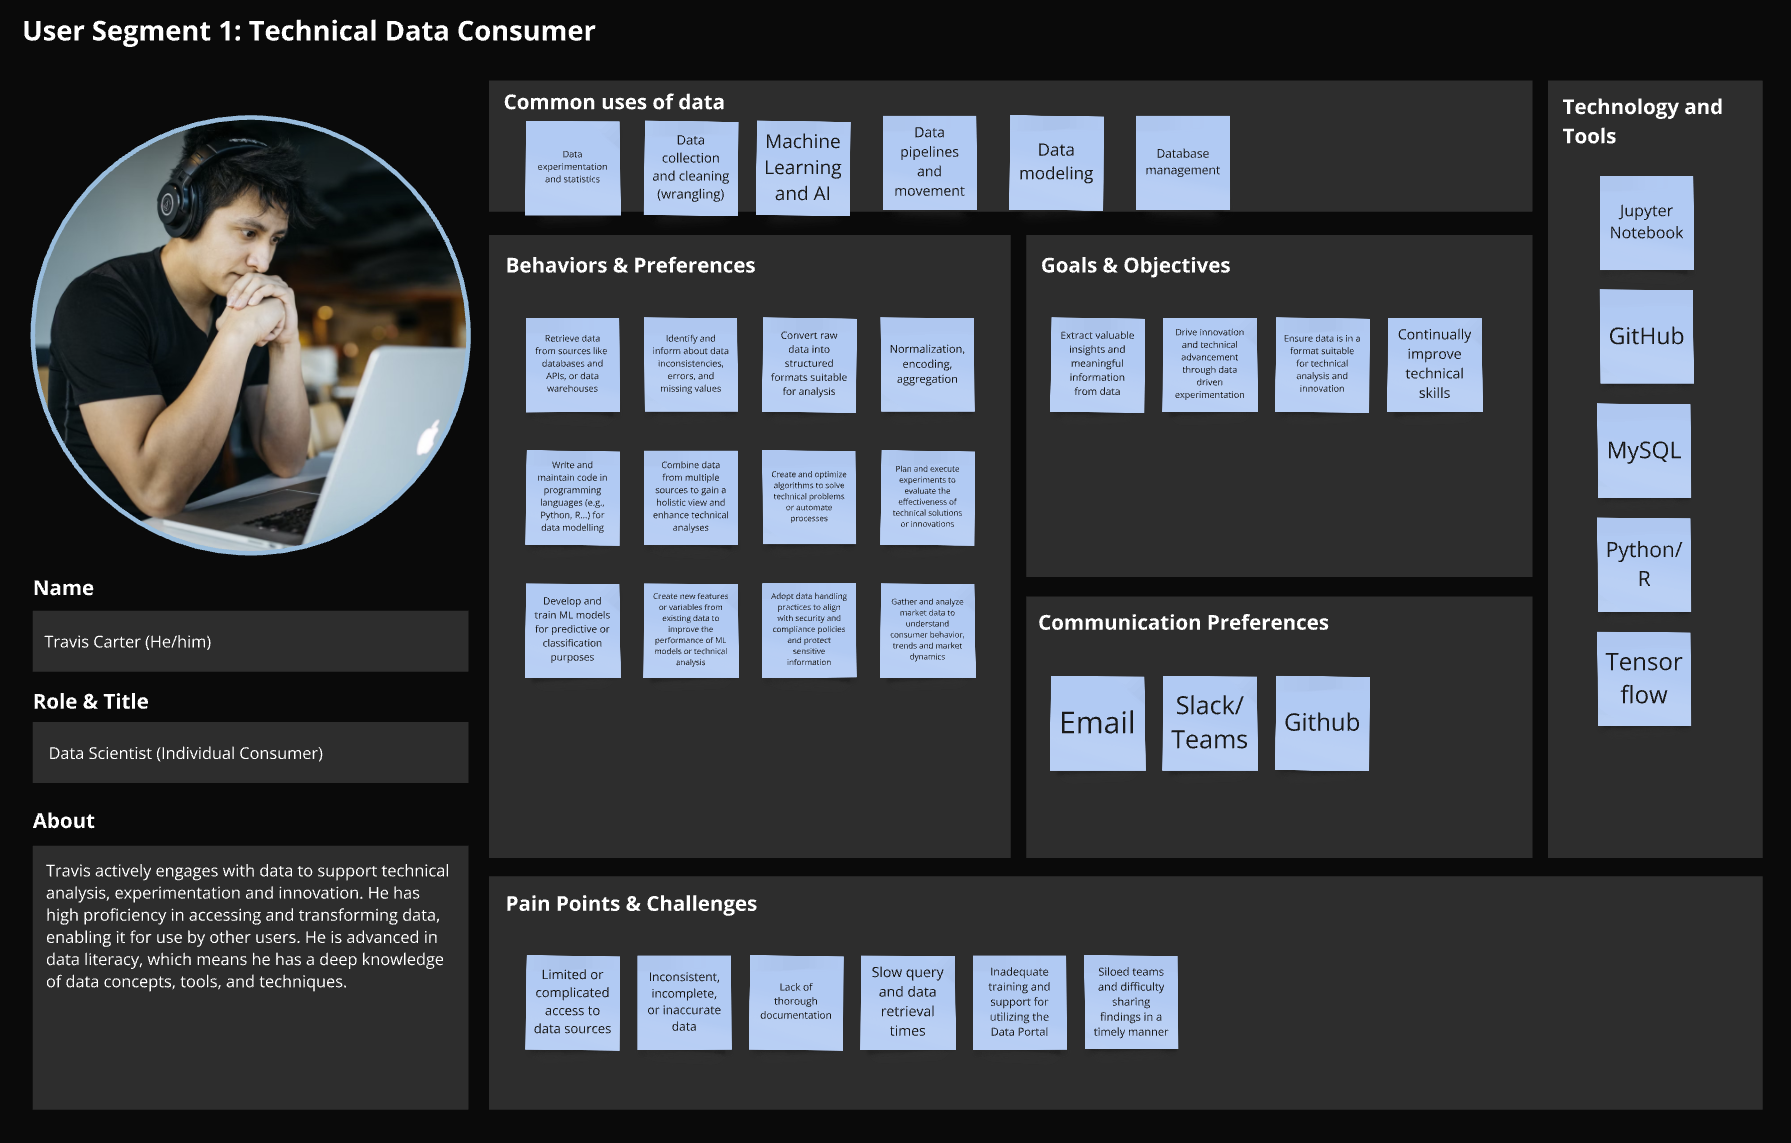
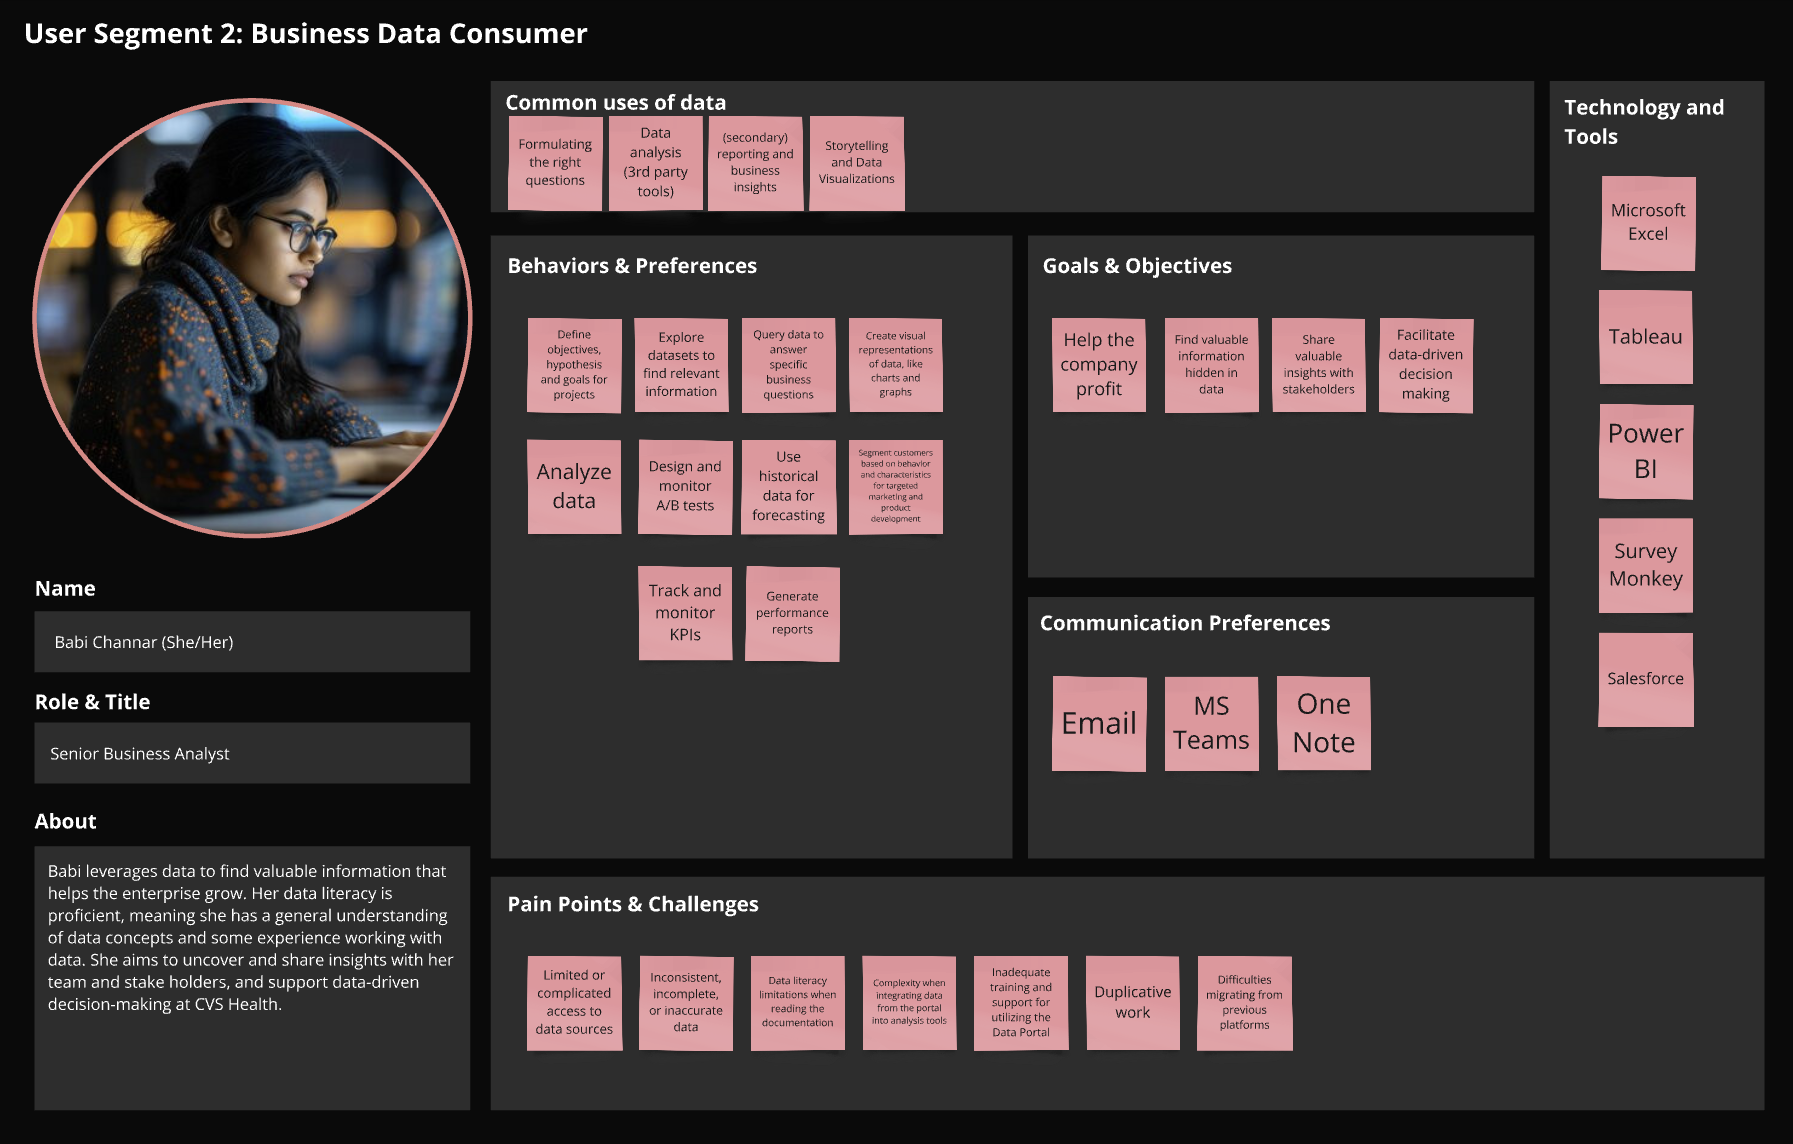
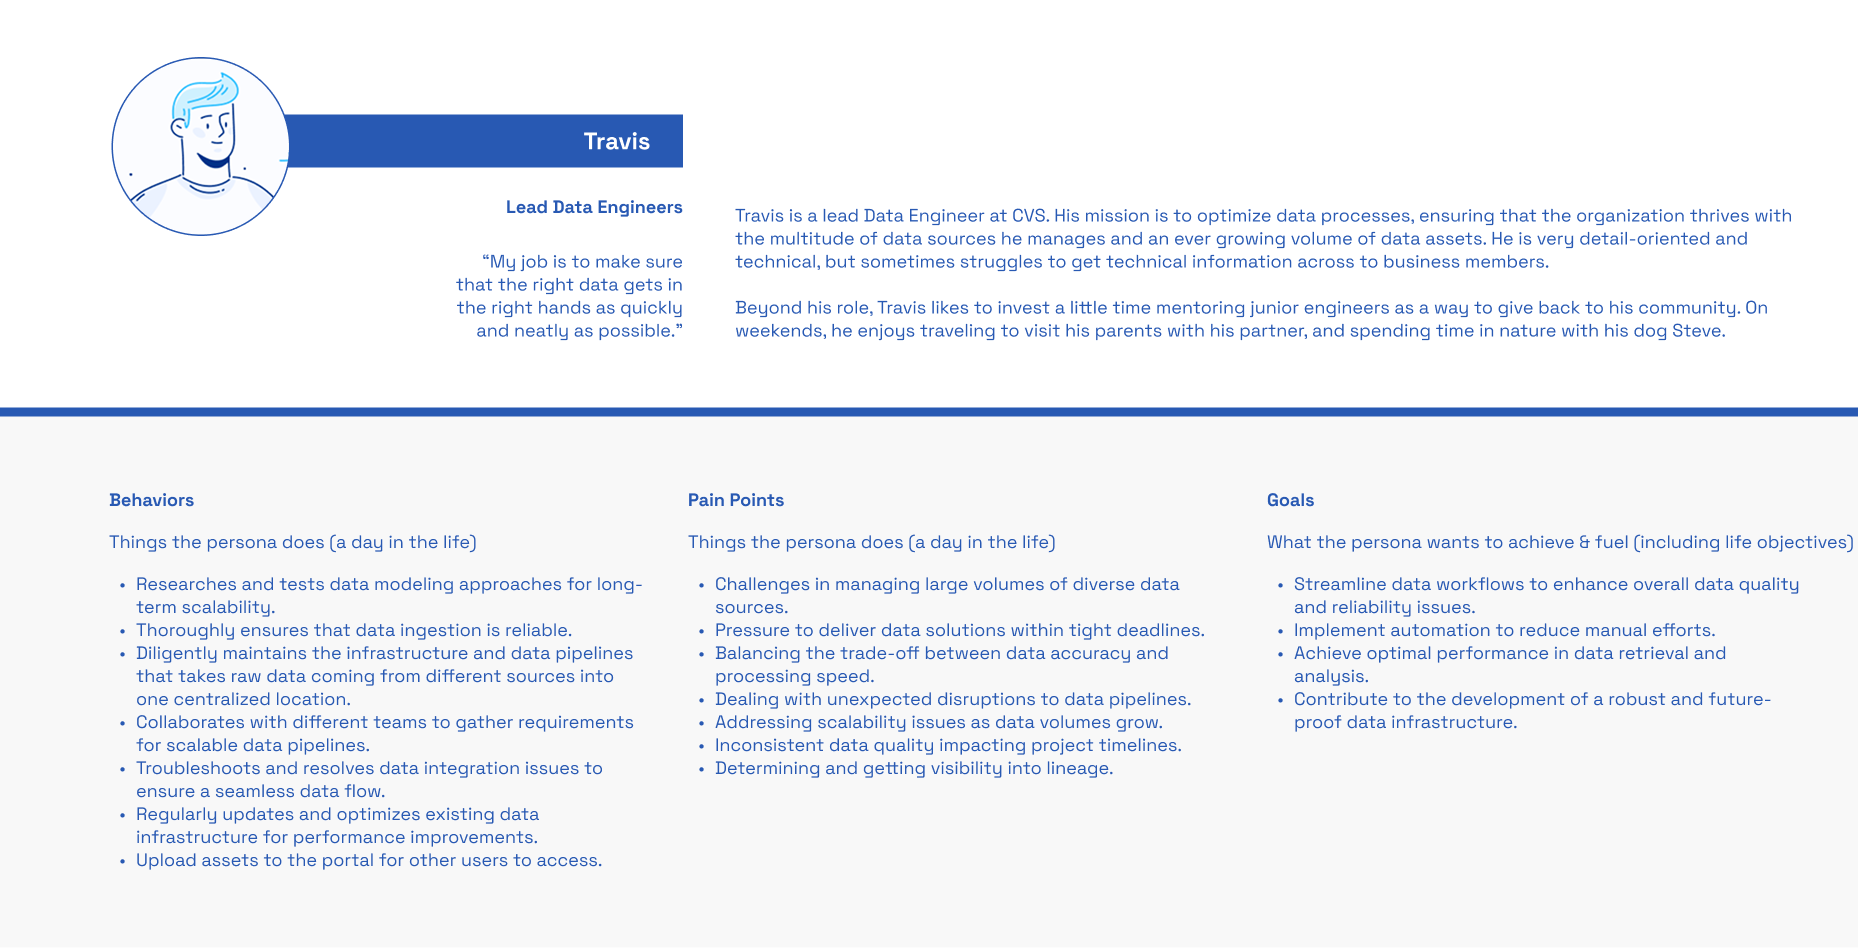
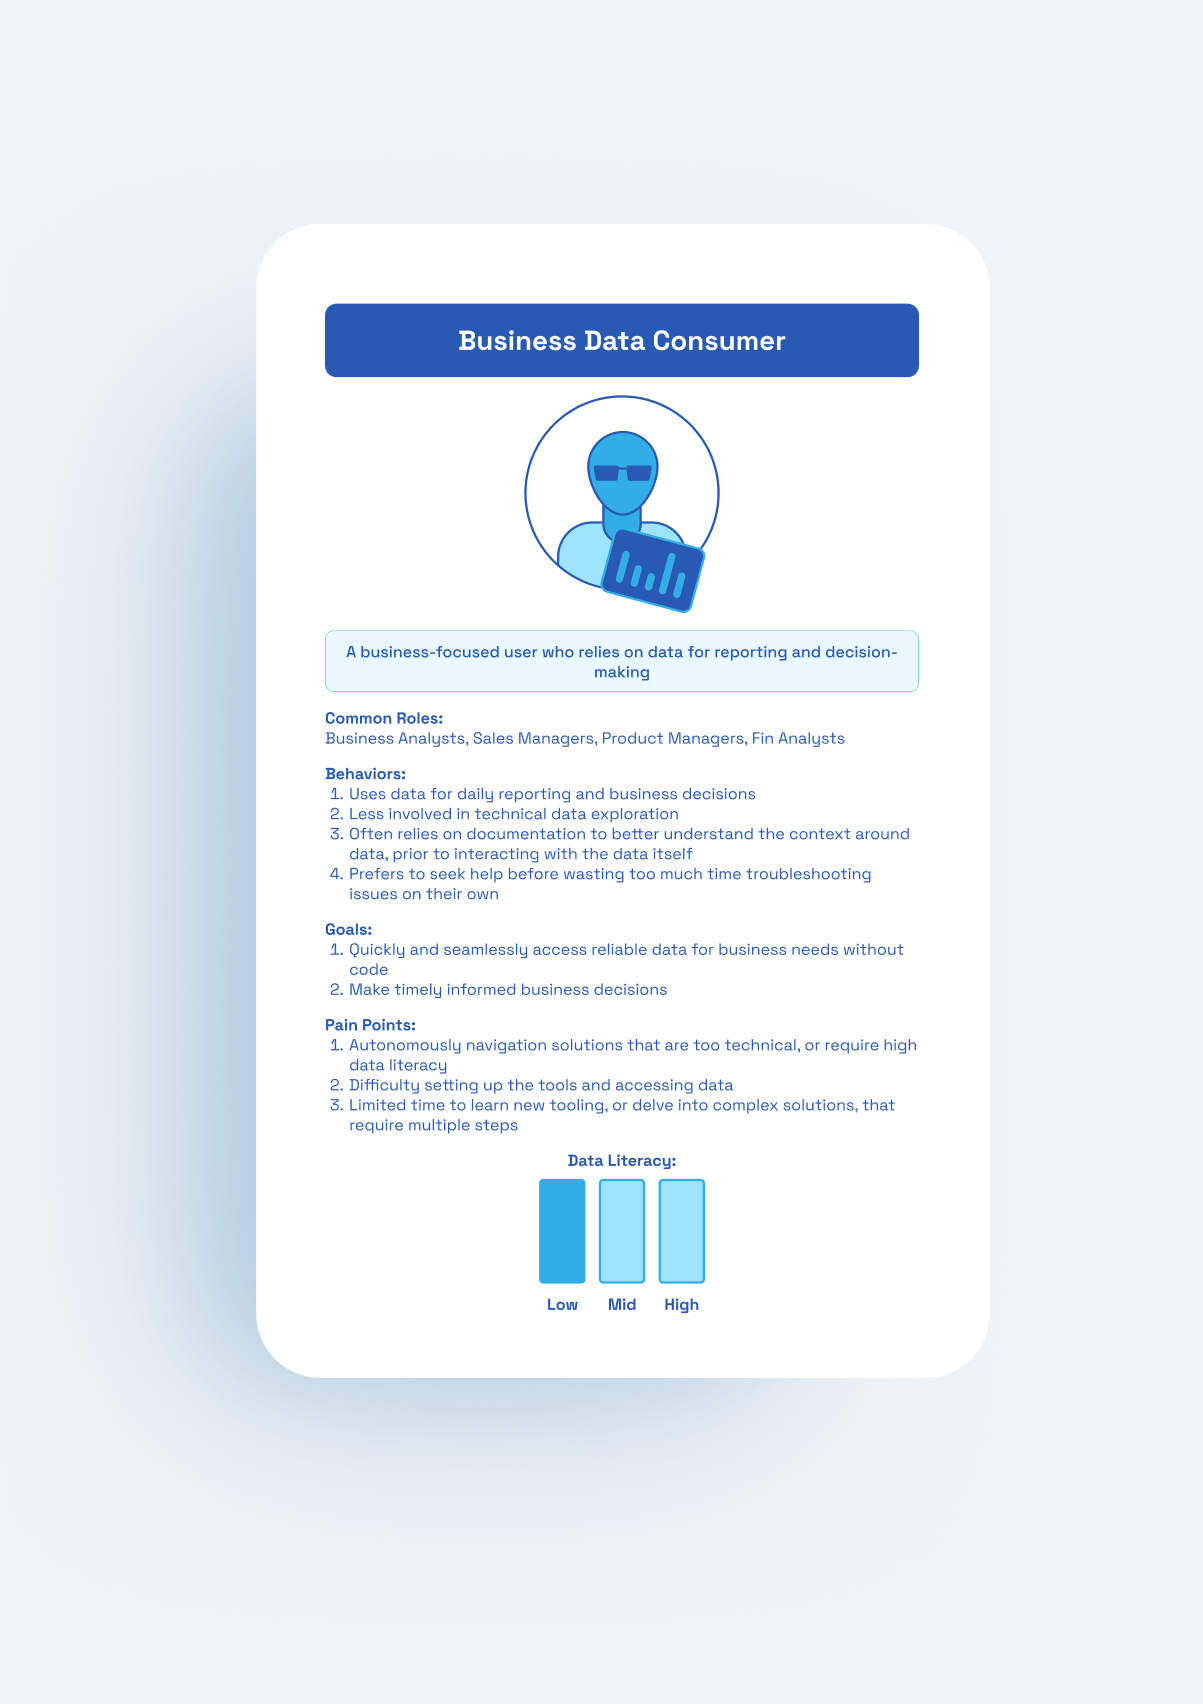
Initial set of 3 personas, segmented by data literacy and familiarity. (e.g., Travis, the Technical Data Consumer, and Babi, the Business Data Consumer).
Reference deck for our designers, product, and project managers to leverage and facilitate the creation of user-centered features across Data Platform teams.
IDENTIFIED POINTS FOR IMPROVEMENT
In this first iteration, I failed to capture the diverse needs within each user group, leading to a lot of overlap in content between groups.
I overlooked users directly connected to governance, platform management, and other capabilities, focusing only on the marketplace capability.
I focused too heavily on tools and communication preferences, which required more validation and were new features under development that I did not have visibility into.
Lacked a nuanced approach to address broader user behaviors, dependencies, and goals.
USER personas
iteration 2: GOVERNANCE PERSONAS
Dec 2023
Activities
Built on the initial persona set by conducting additional interviews, expanding research, and observing core users in action.
Facilitated extended calls and detailed email exchanges with collaborators to clarify the distinction between users and stakeholders before refining personas.
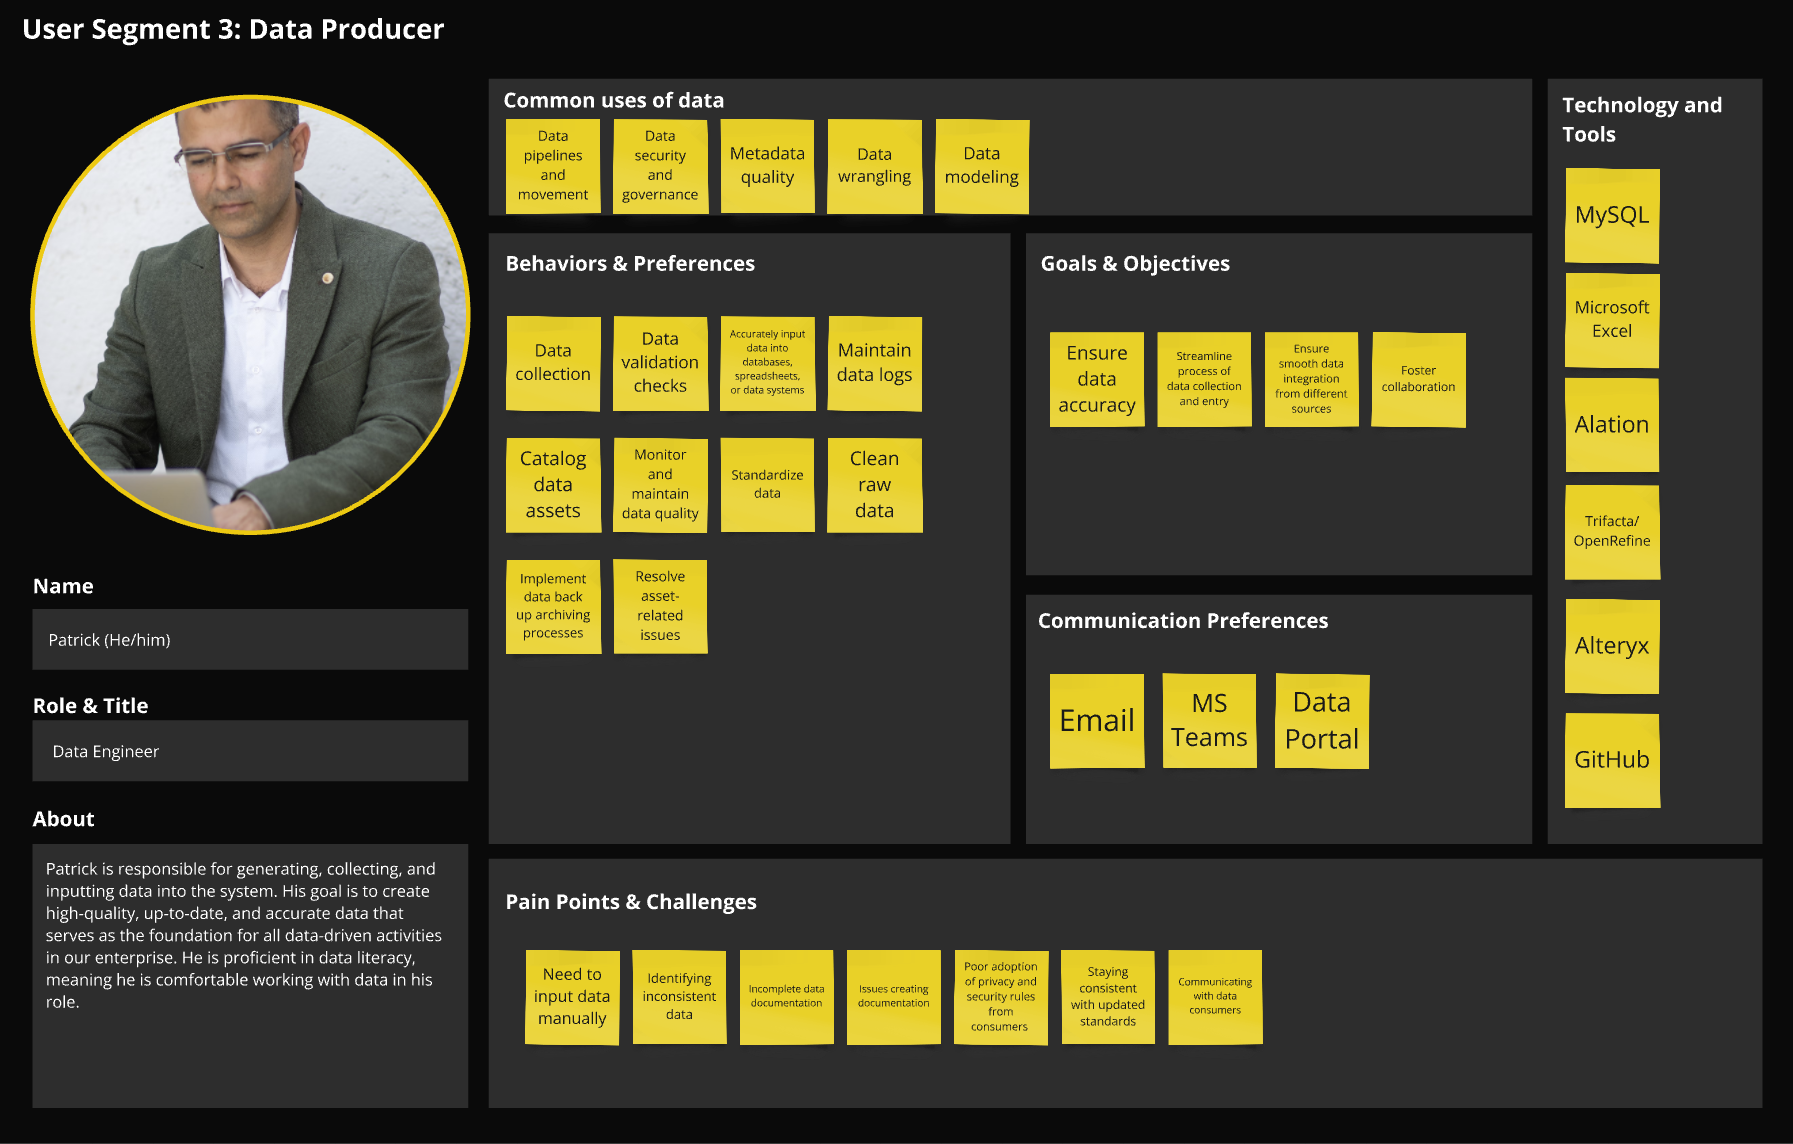
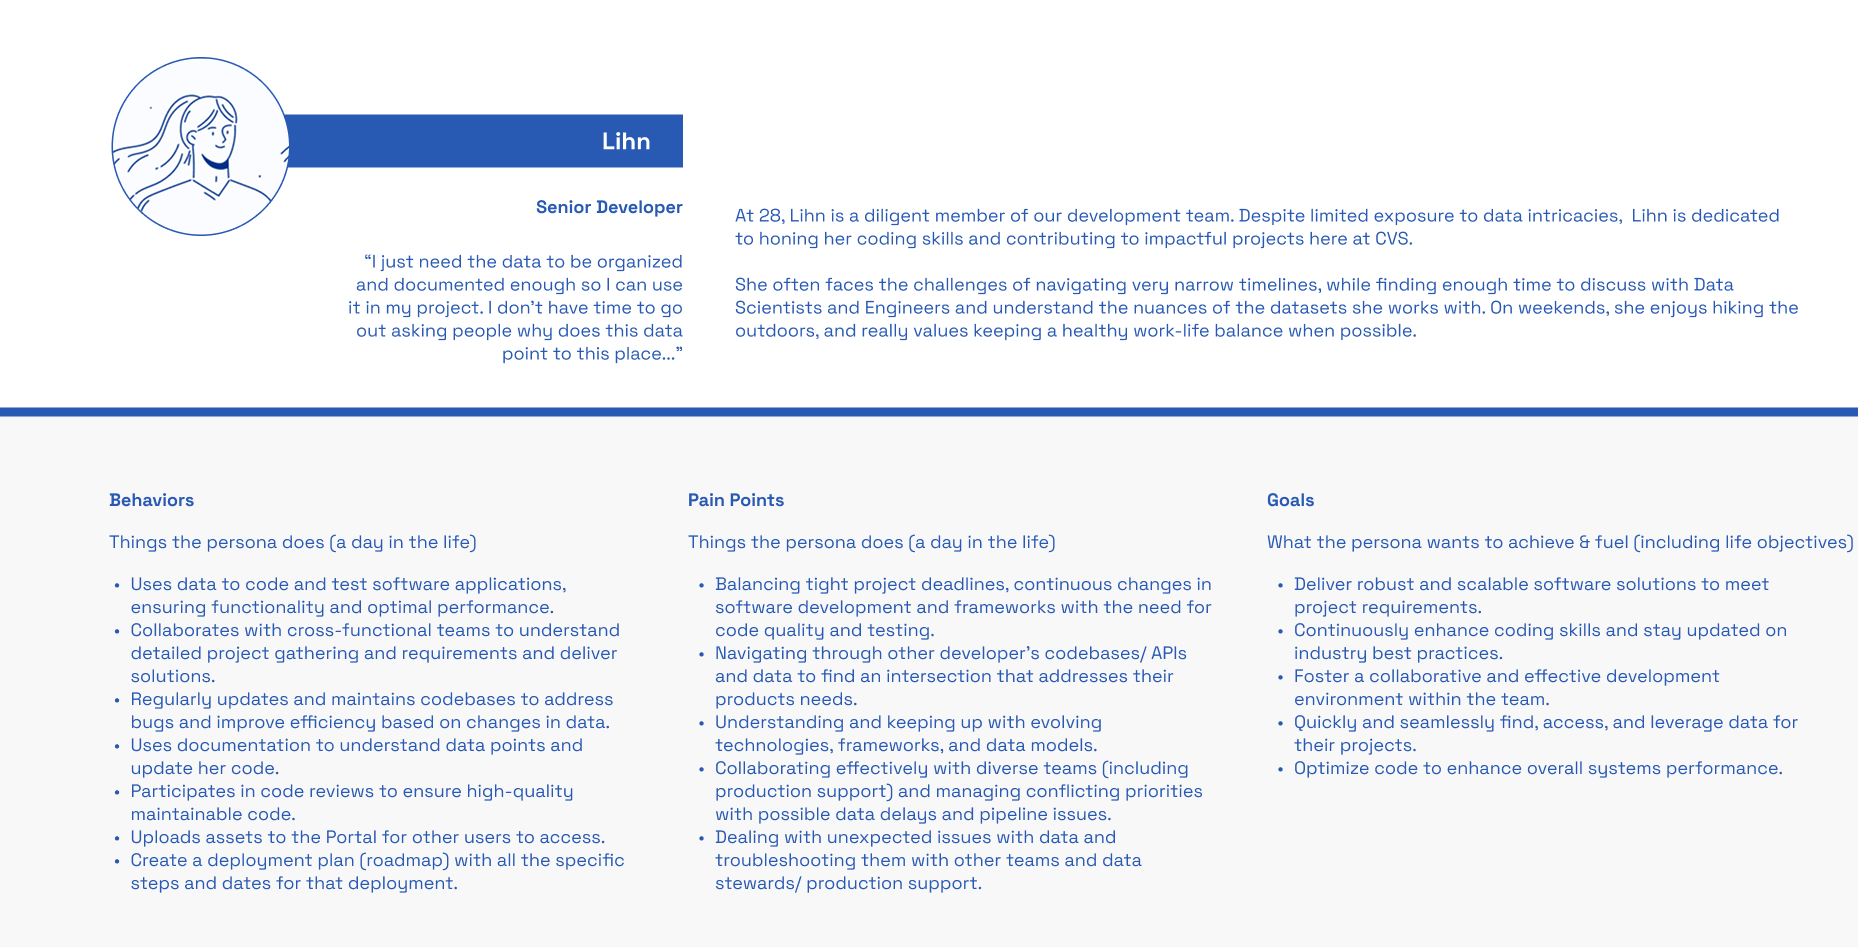
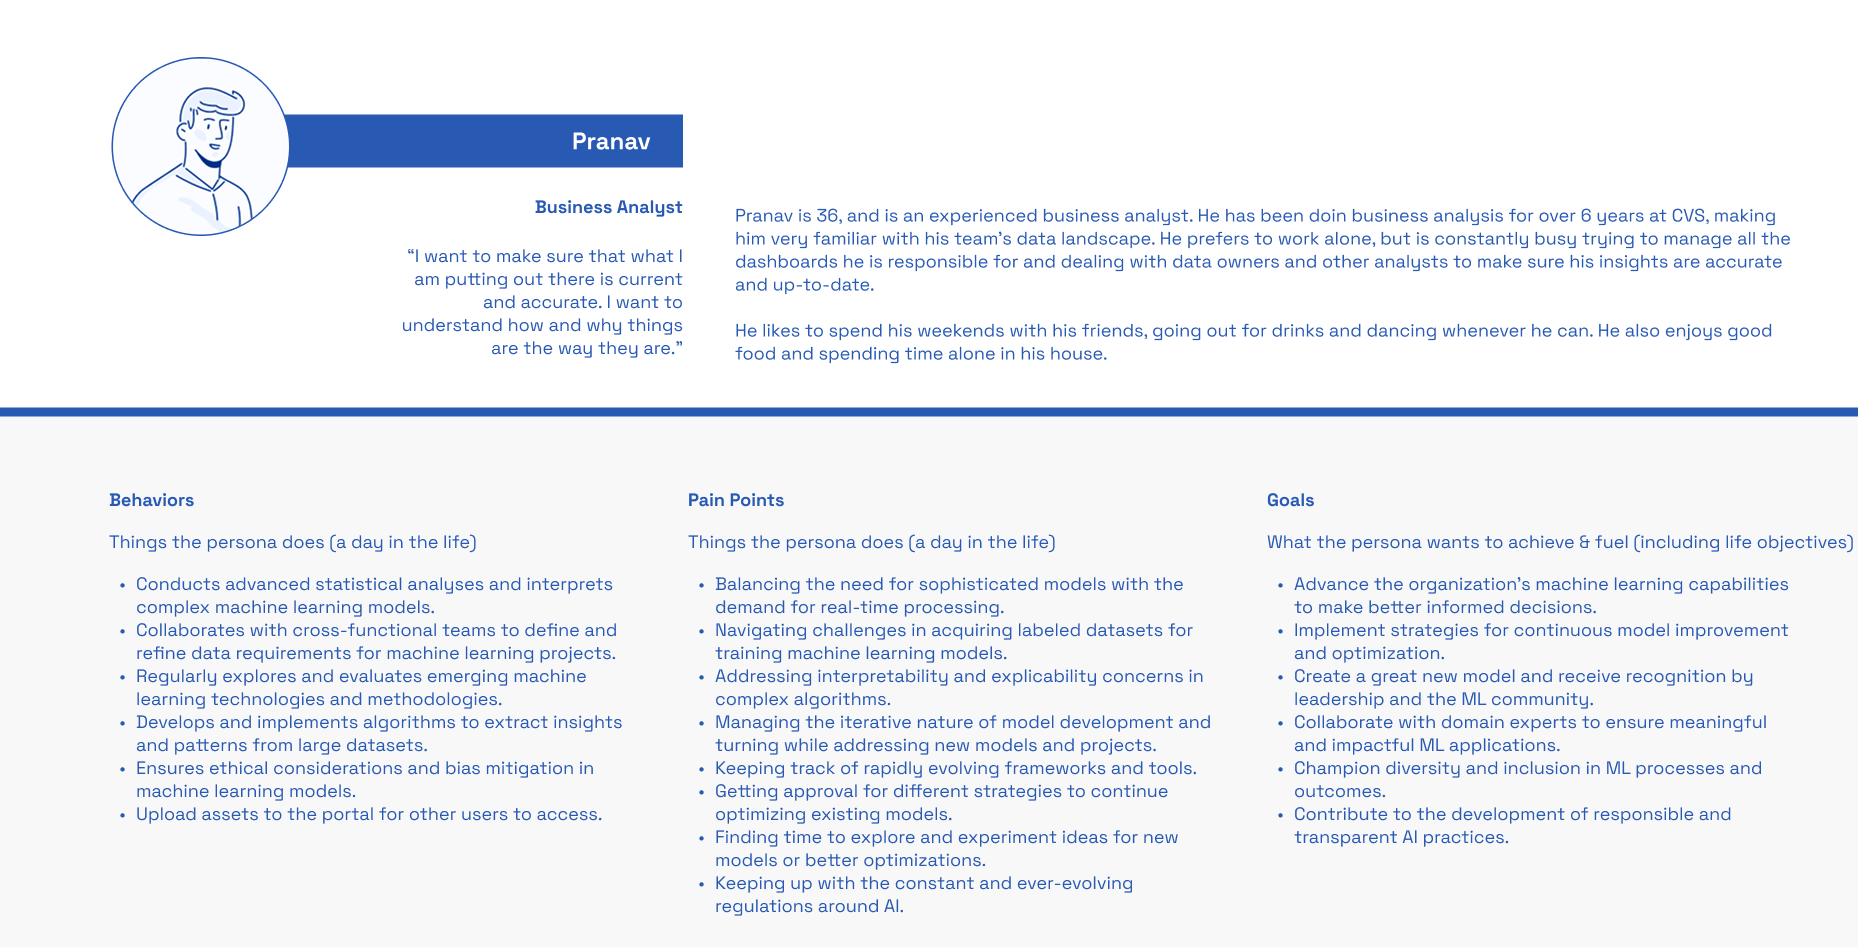
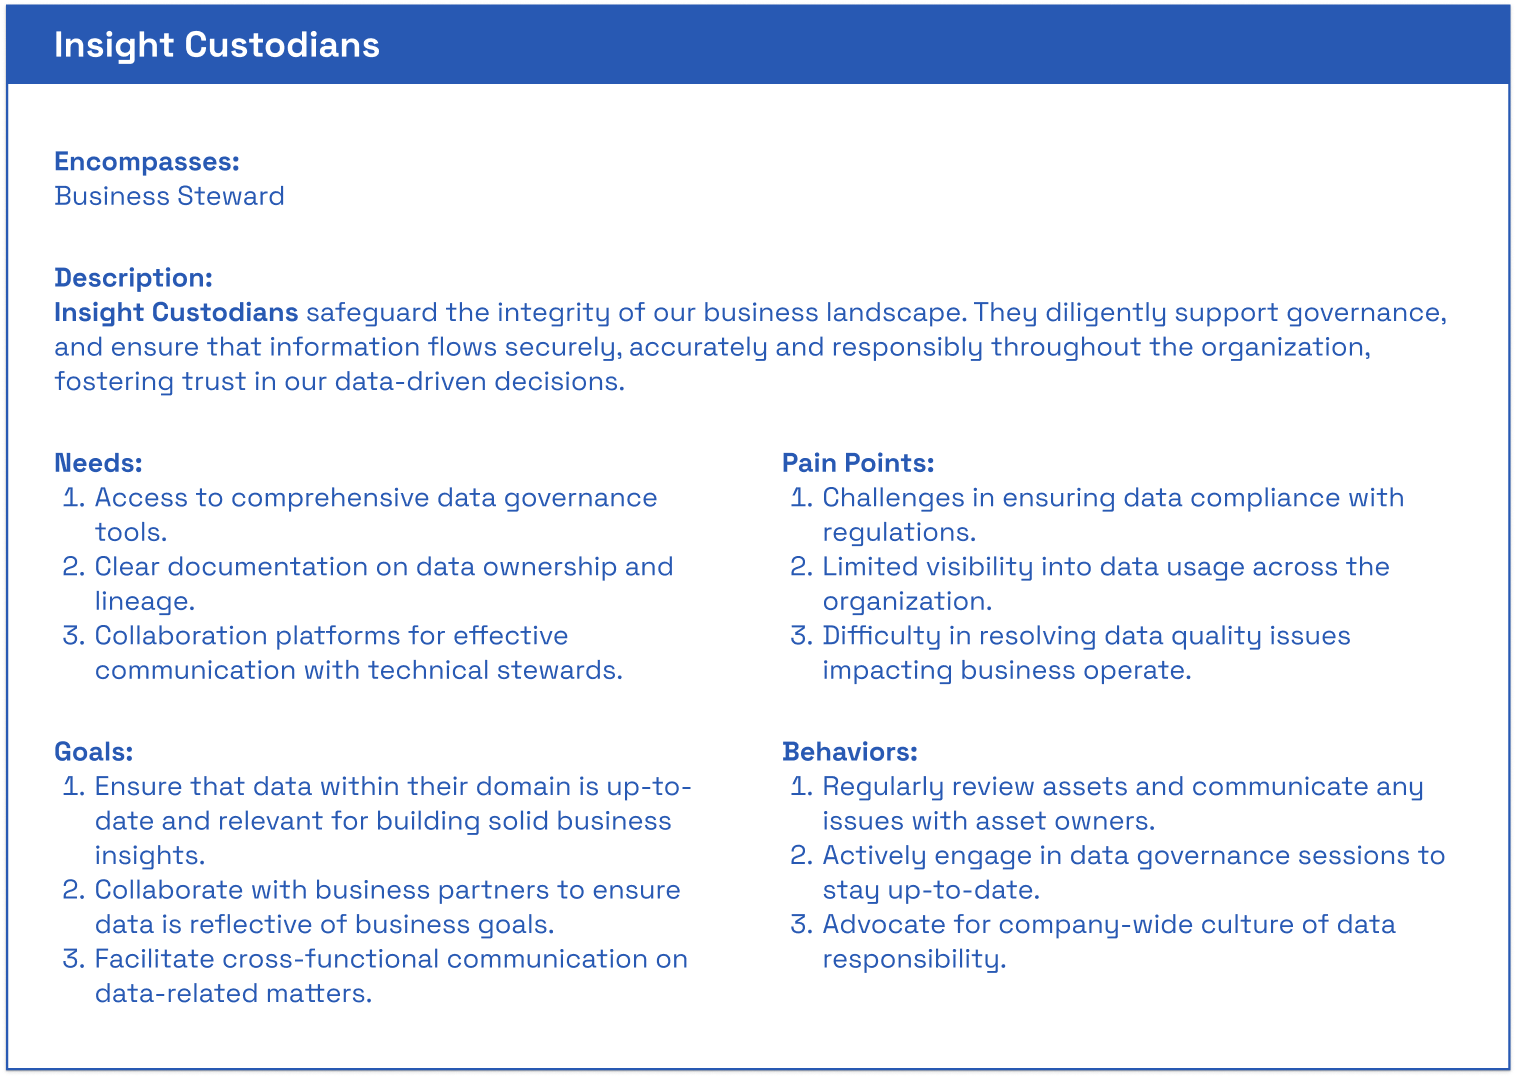
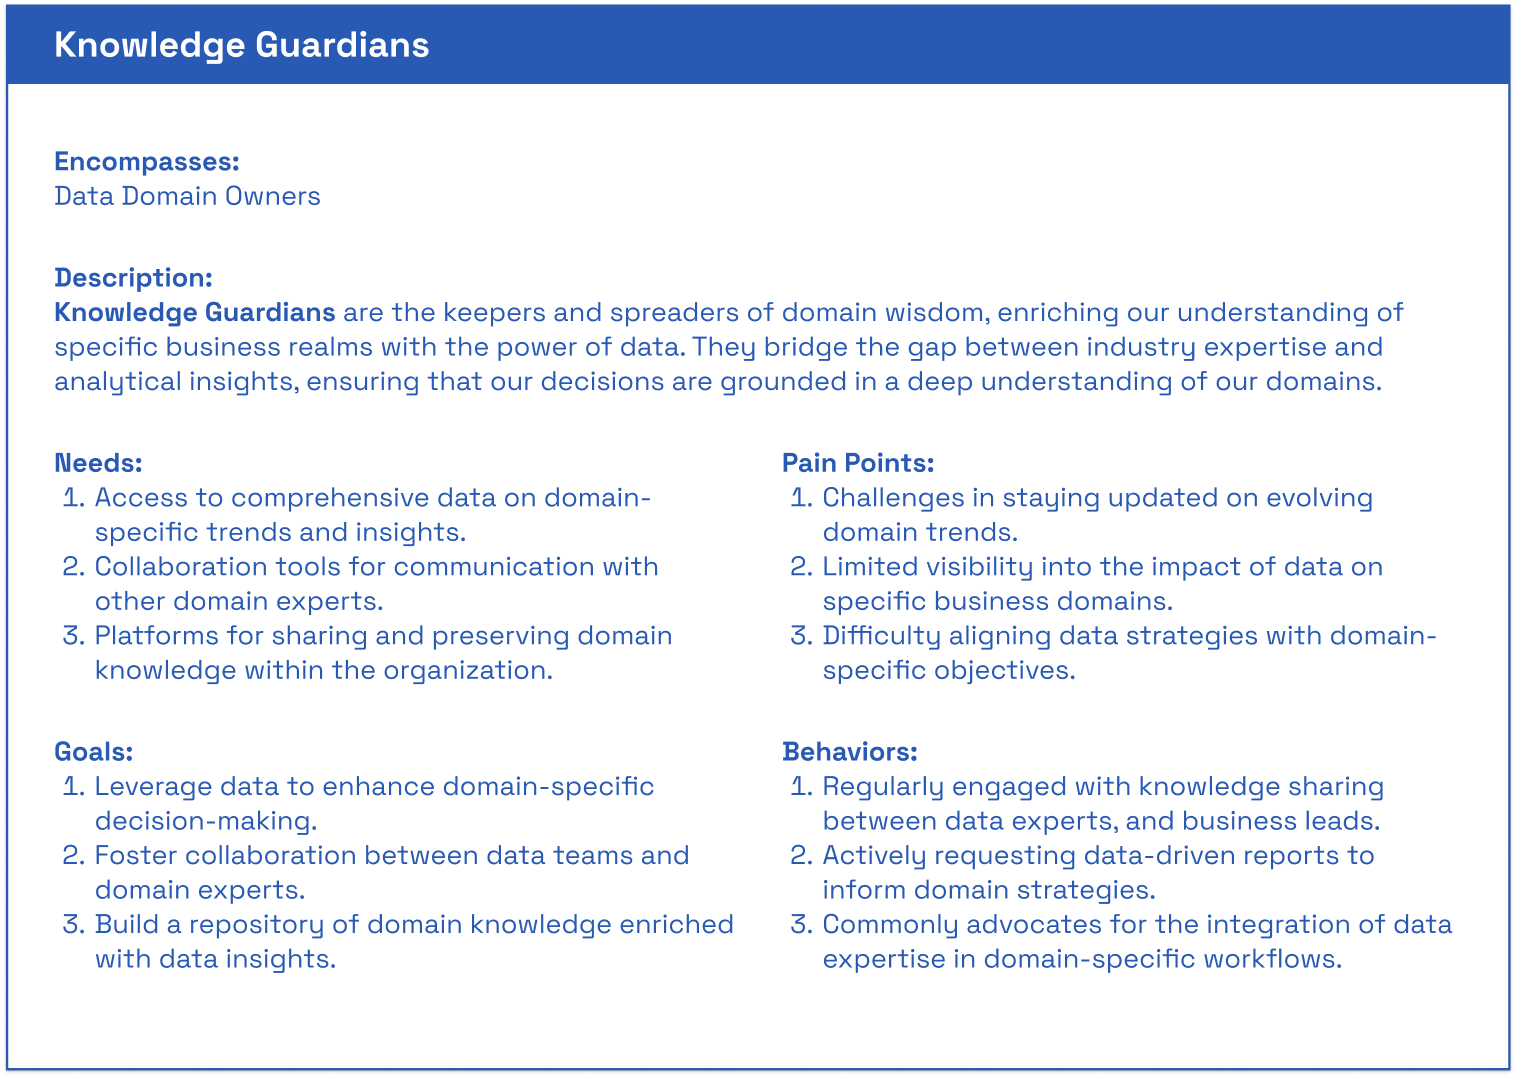
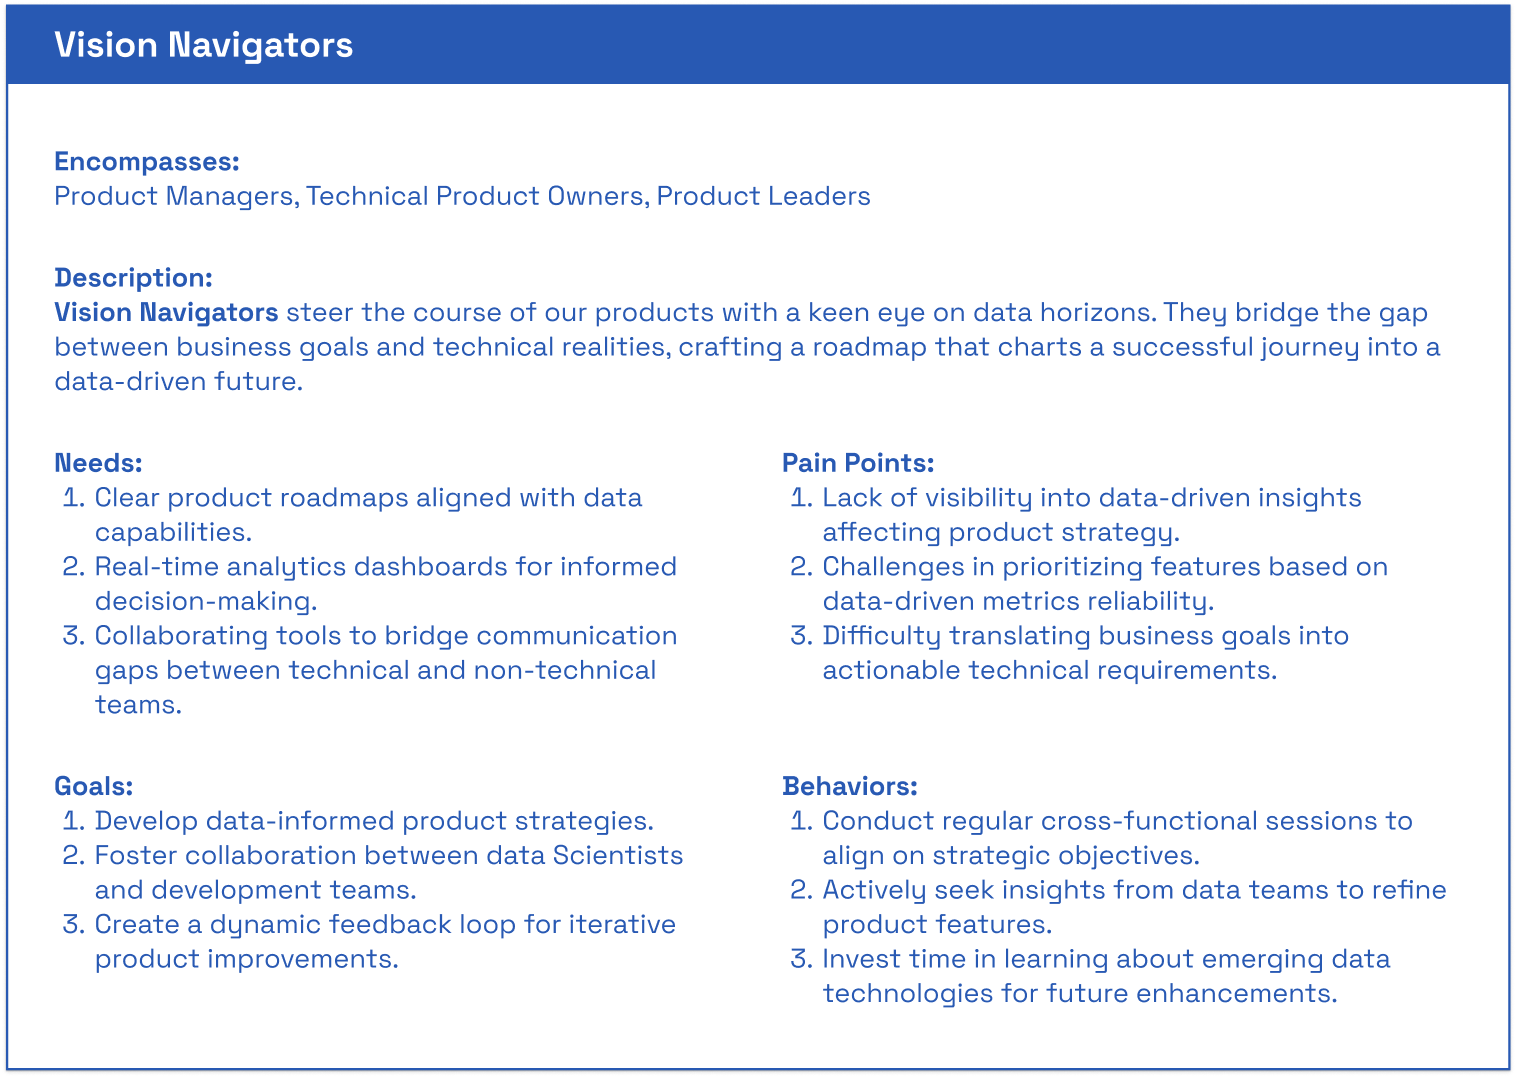
Introduced five profiles in this iteration: Travis – Technical Consumer, Babi – Business Consumer, Patrick – Data Producer, Garian – Data Governor, Silvia – Data Steward.
Learning
Identified that the most significant challenge at this stage was not user-related, but aligning collaborators’ understanding of user versus stakeholder roles — a recurring issue within the internal solution design teams.
Realized the persona format did not focus on what mattered the most: understanding what people did with data in their day-to-day jobs.
OUTCOMES
Delivered a second-iteration persona set that expanded role coverage and included governance internal roles.
Used the internal model for personas, leveraging one of the Enterprise Design and Research templates.
Maintained momentum toward a more accurate and actionable persona framework, while acknowledging that refinement was still needed.
IDENTIFIED POINTS FOR IMPROVEMENT
Work on clarifying and building shared understanding among collaborators early in the process to reduce misalignment of what the goal is for personas/ archetypes.
Keep persona details focused on actionable insights, avoiding unnecessary background that could dilute usability.
Personas

iteration 3: CREATIVE archetypes
Jan 2024
Activities
Saw myself fall into the trap of mixing governance stakeholder roles with actual user roles. These personas made my job that much harder.
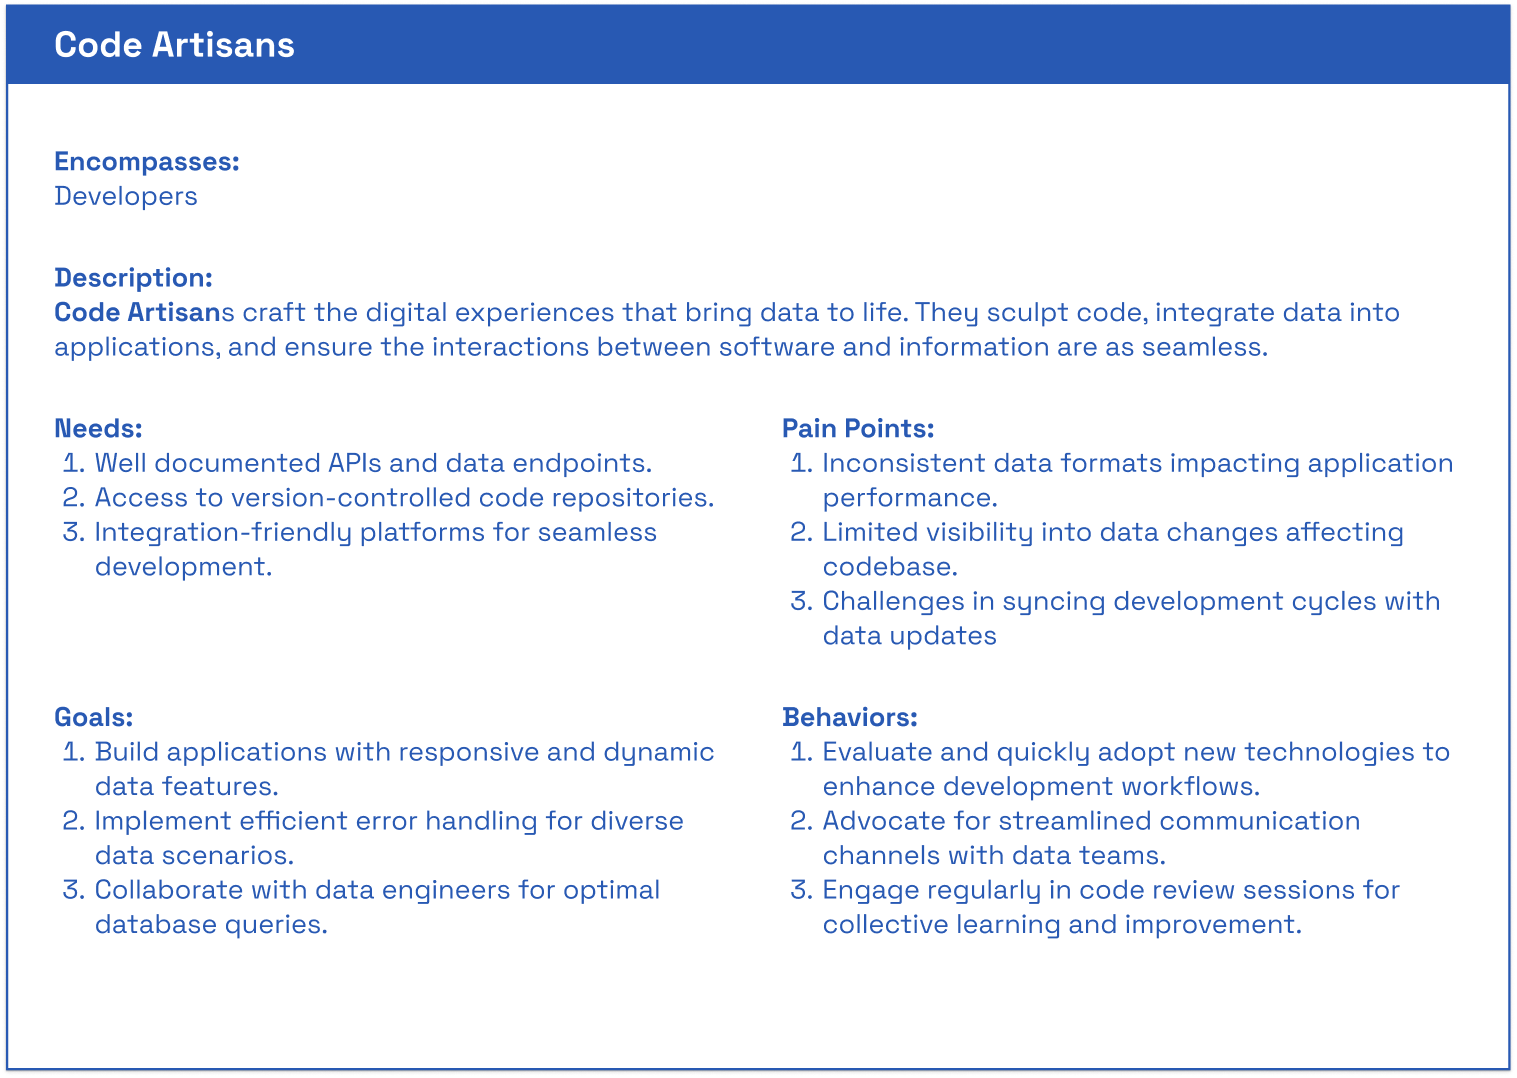
Transitioned from personas to user archetypes.
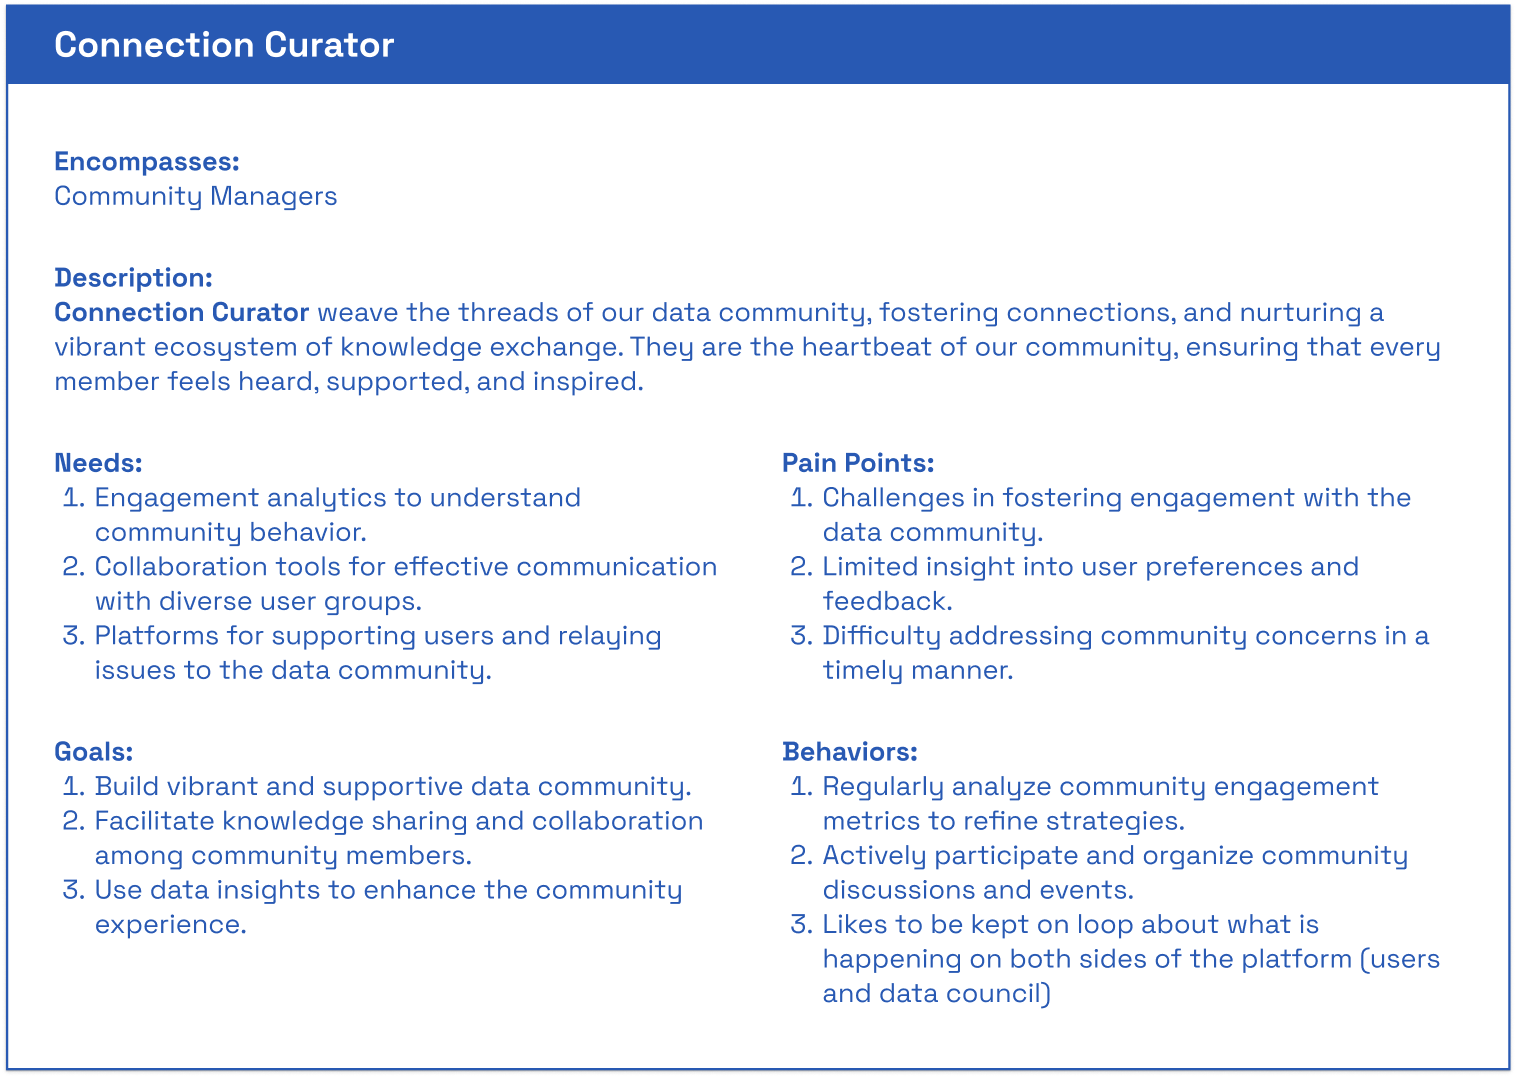
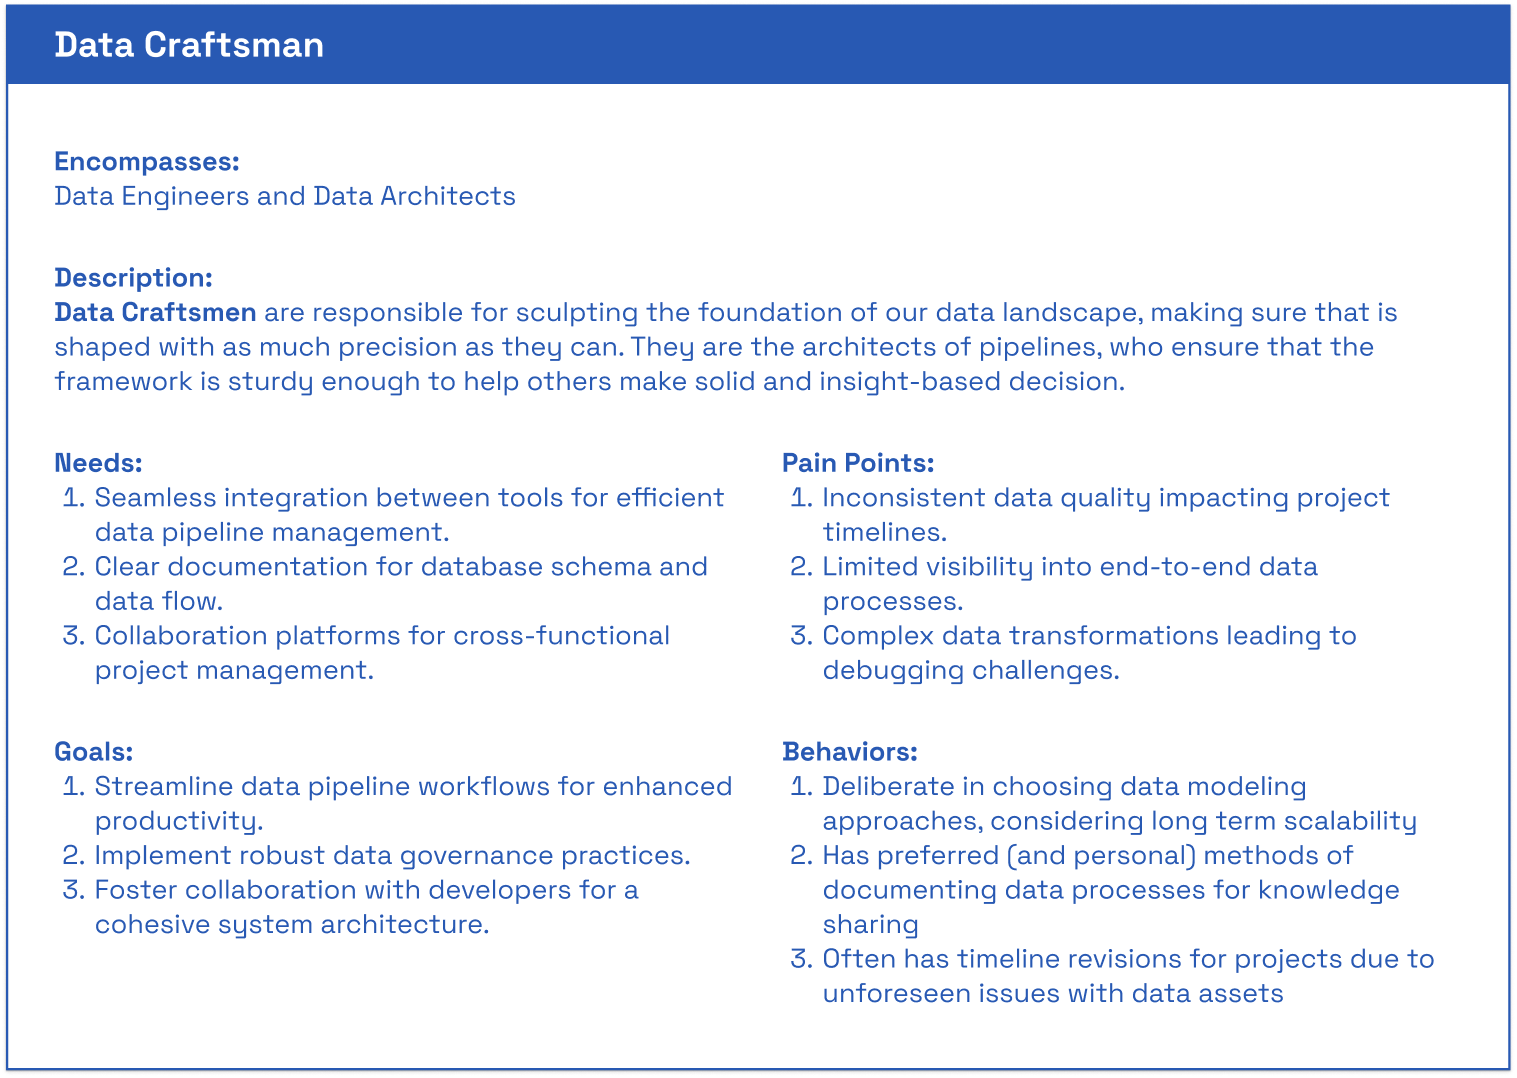
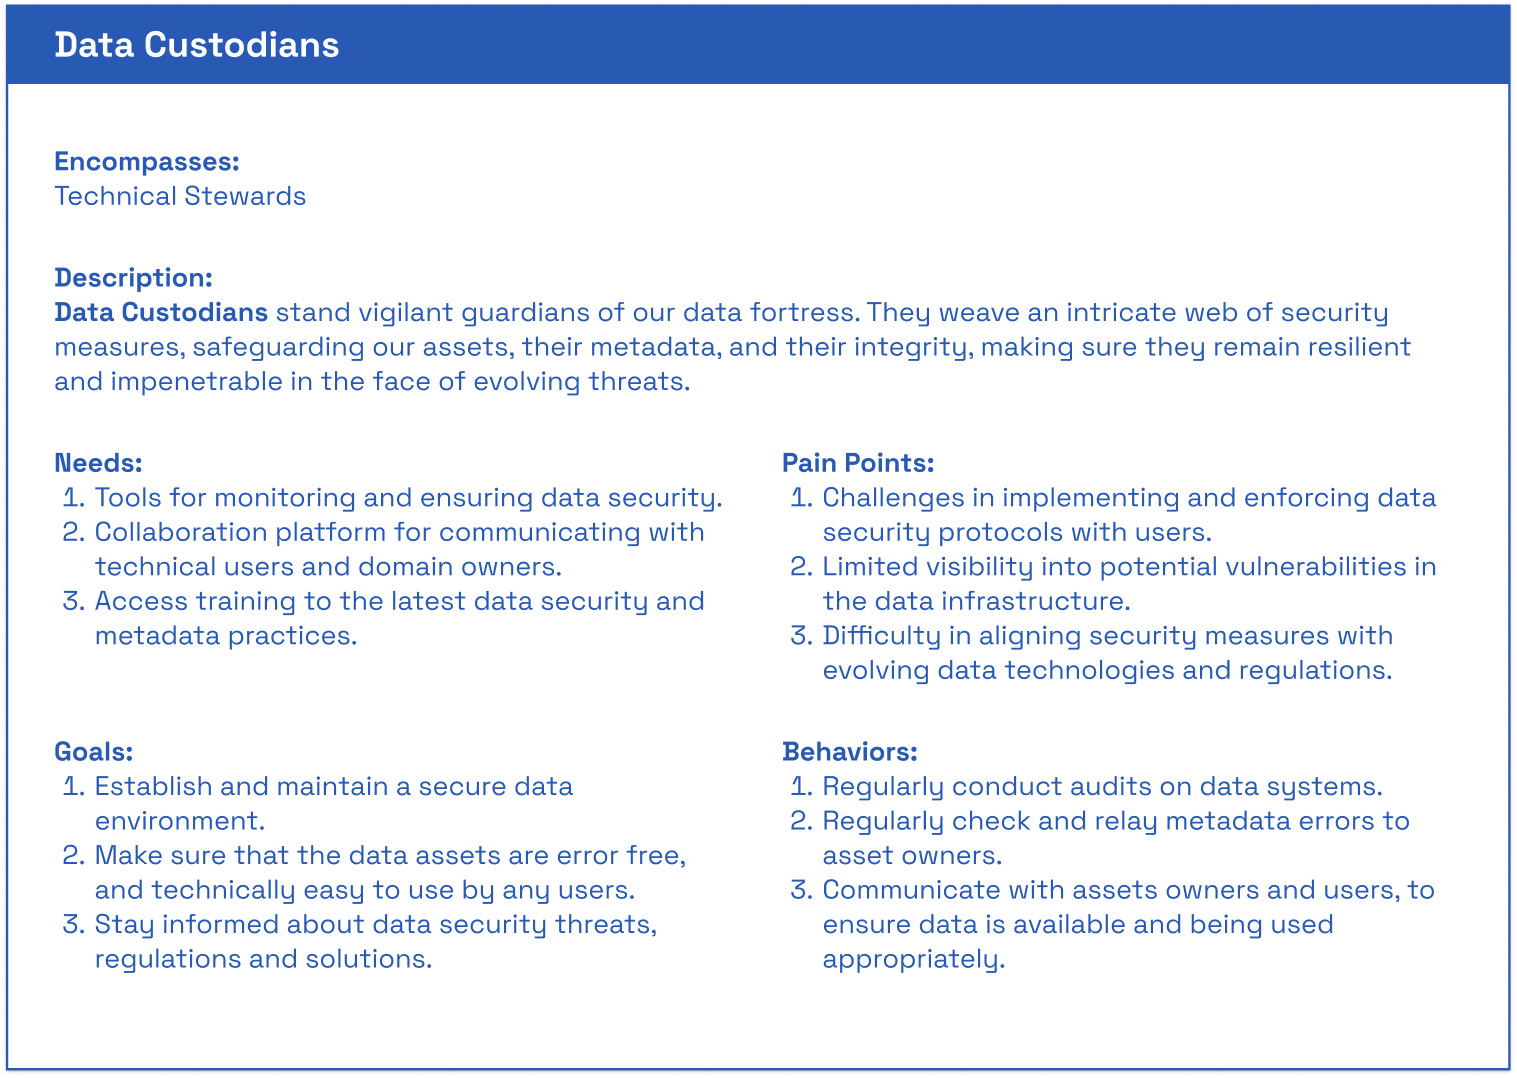
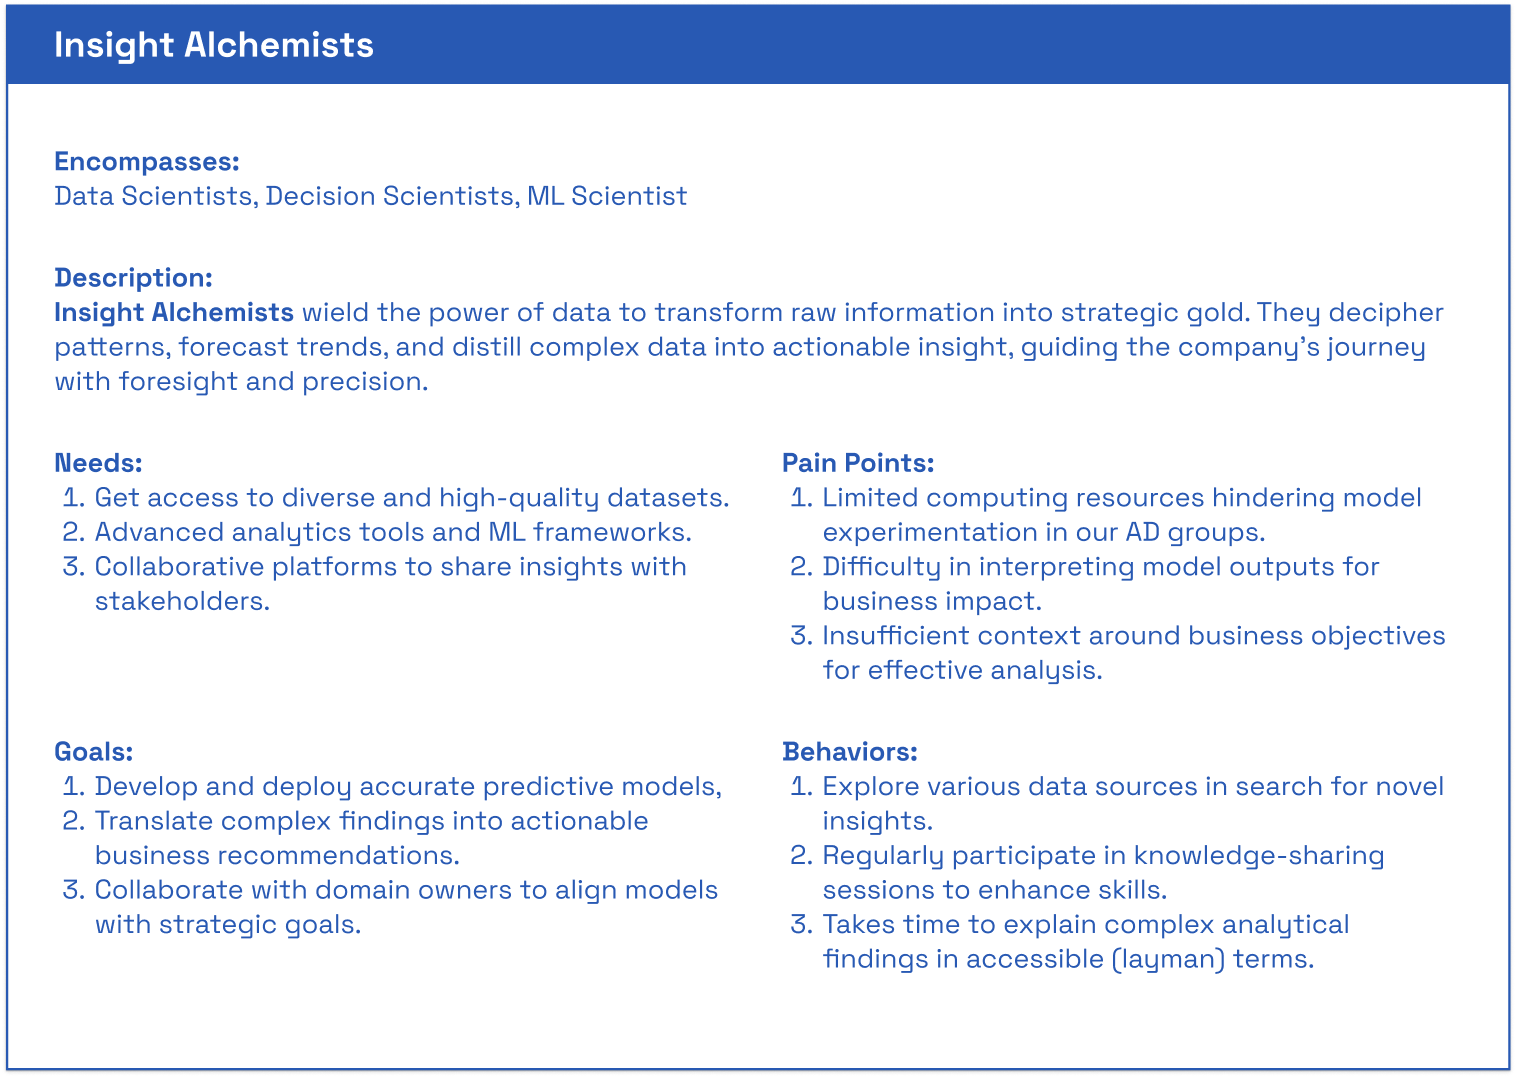
Introduced metaphor-based names such as Data Craftsman and Insight Alchemist.
Defined each archetype with descriptive narratives, trying to capture their approach to data and decision-making.
Learning
Even though I was leaning in the right direction - shifting from people’s roles, and job names, to their relationship with data, that was still not it.
Metaphorical names did not suit my audience and added an unnecessary level of abstraction.
Stakeholders struggled to quickly connect archetype names to actual roles, responsibilities, or design implications.
The format still leaned toward descriptive storytelling rather than concise, actionable reference points.
OUTCOMES
Produced a set of archetypes that moved away from overloaded persona details.
Established a conceptual framework for grouping users by behaviors and goals rather than job titles alone.
Adoption was limited due to the extra cognitive step required to interpret the names.
IDENTIFIED POINTS FOR IMPROVEMENT
Prioritize clarity over creativity in naming conventions to ensure instant recognition.
Provide a consistent, structured format for each archetype to make them easier to scan and apply.
Include role examples and key behaviors to bridge the gap between concept and practical use.
Capture data literacy with more clarity, due to its importance in the current state of the platform and its development.
ARCHETYPEs
iteration 4: enterprise data archetypes
Feb 2024
Activities
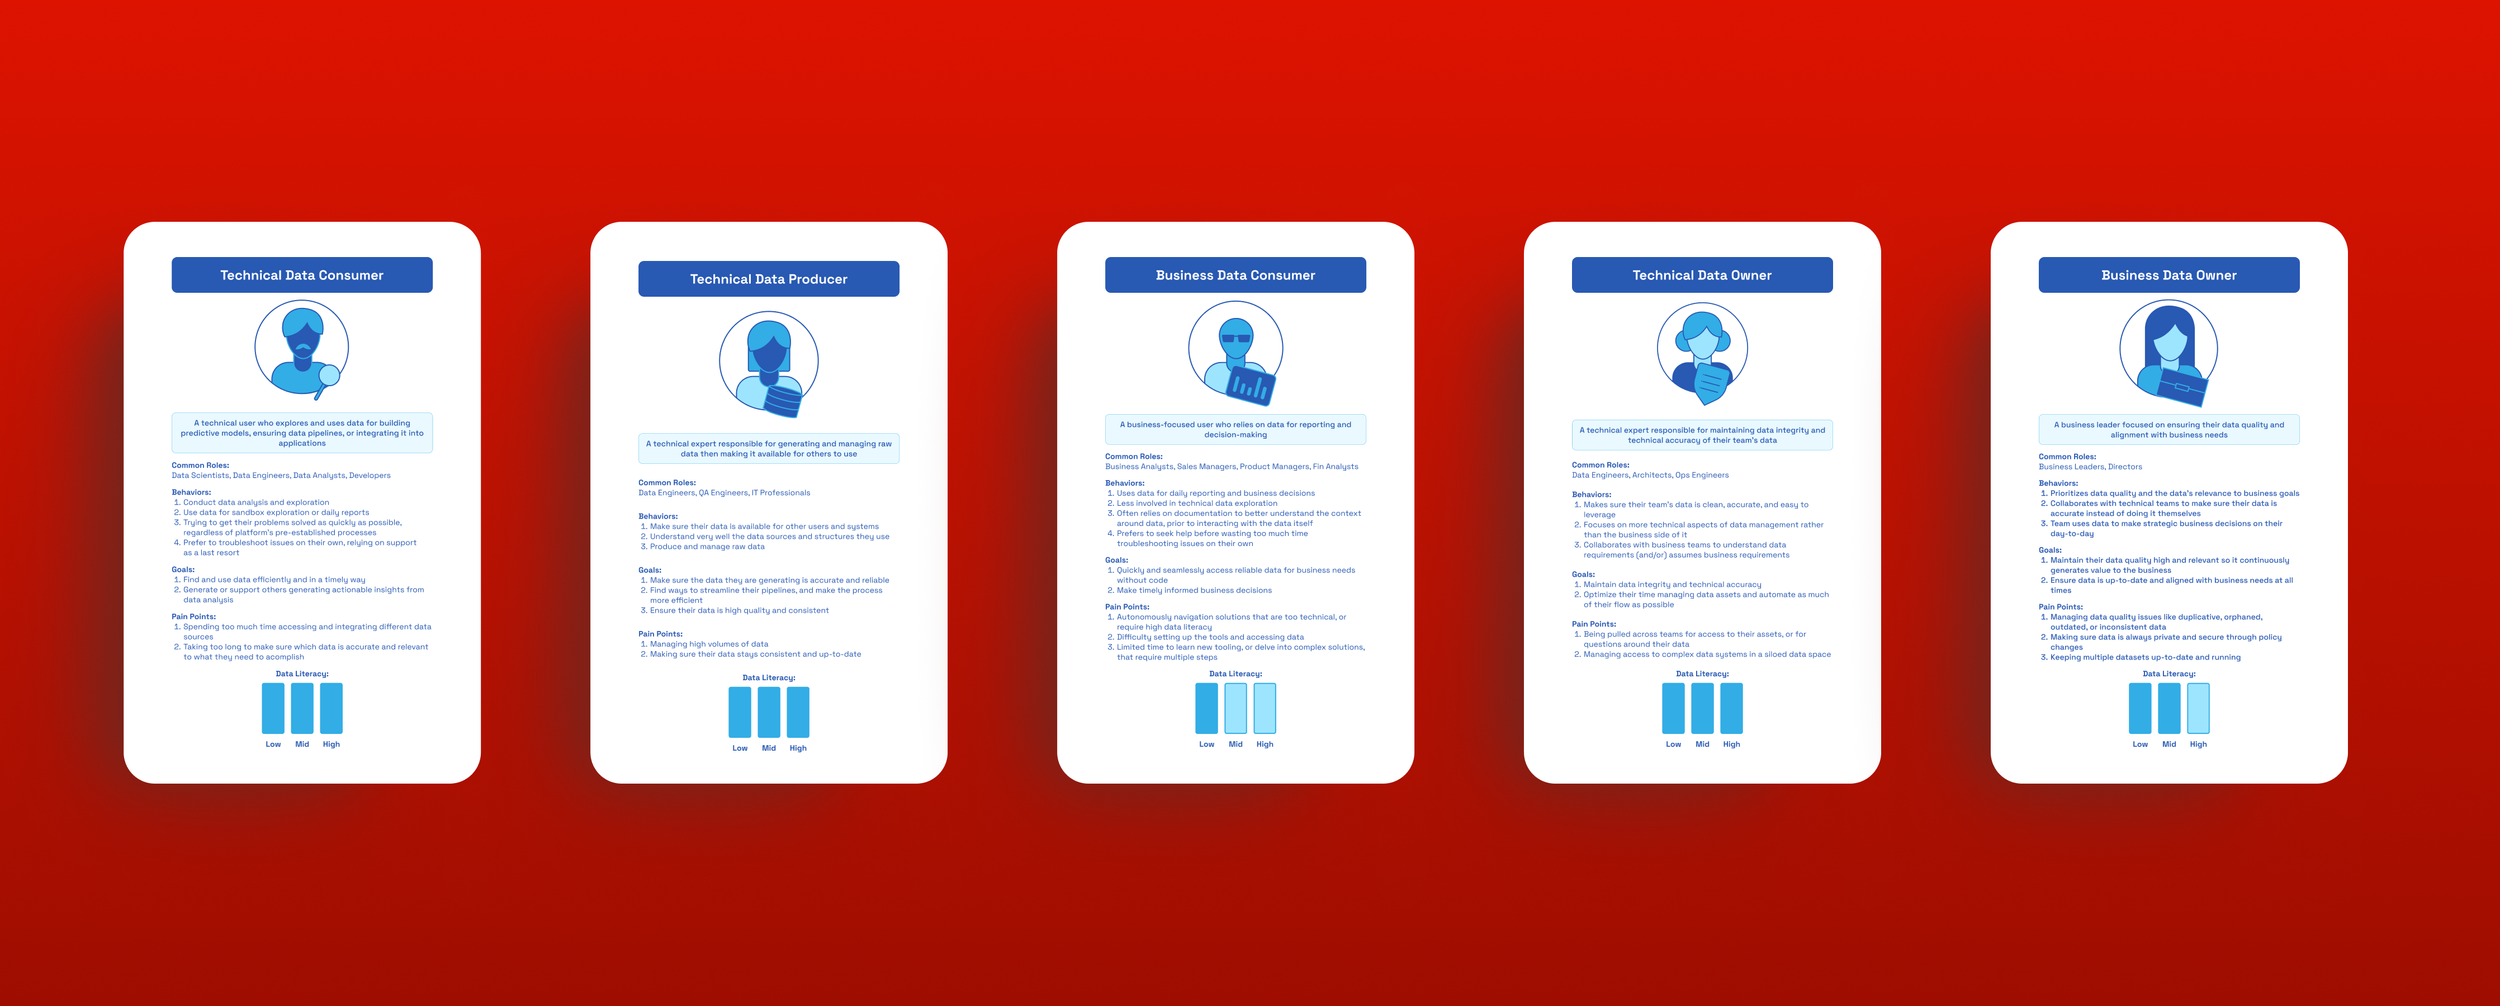
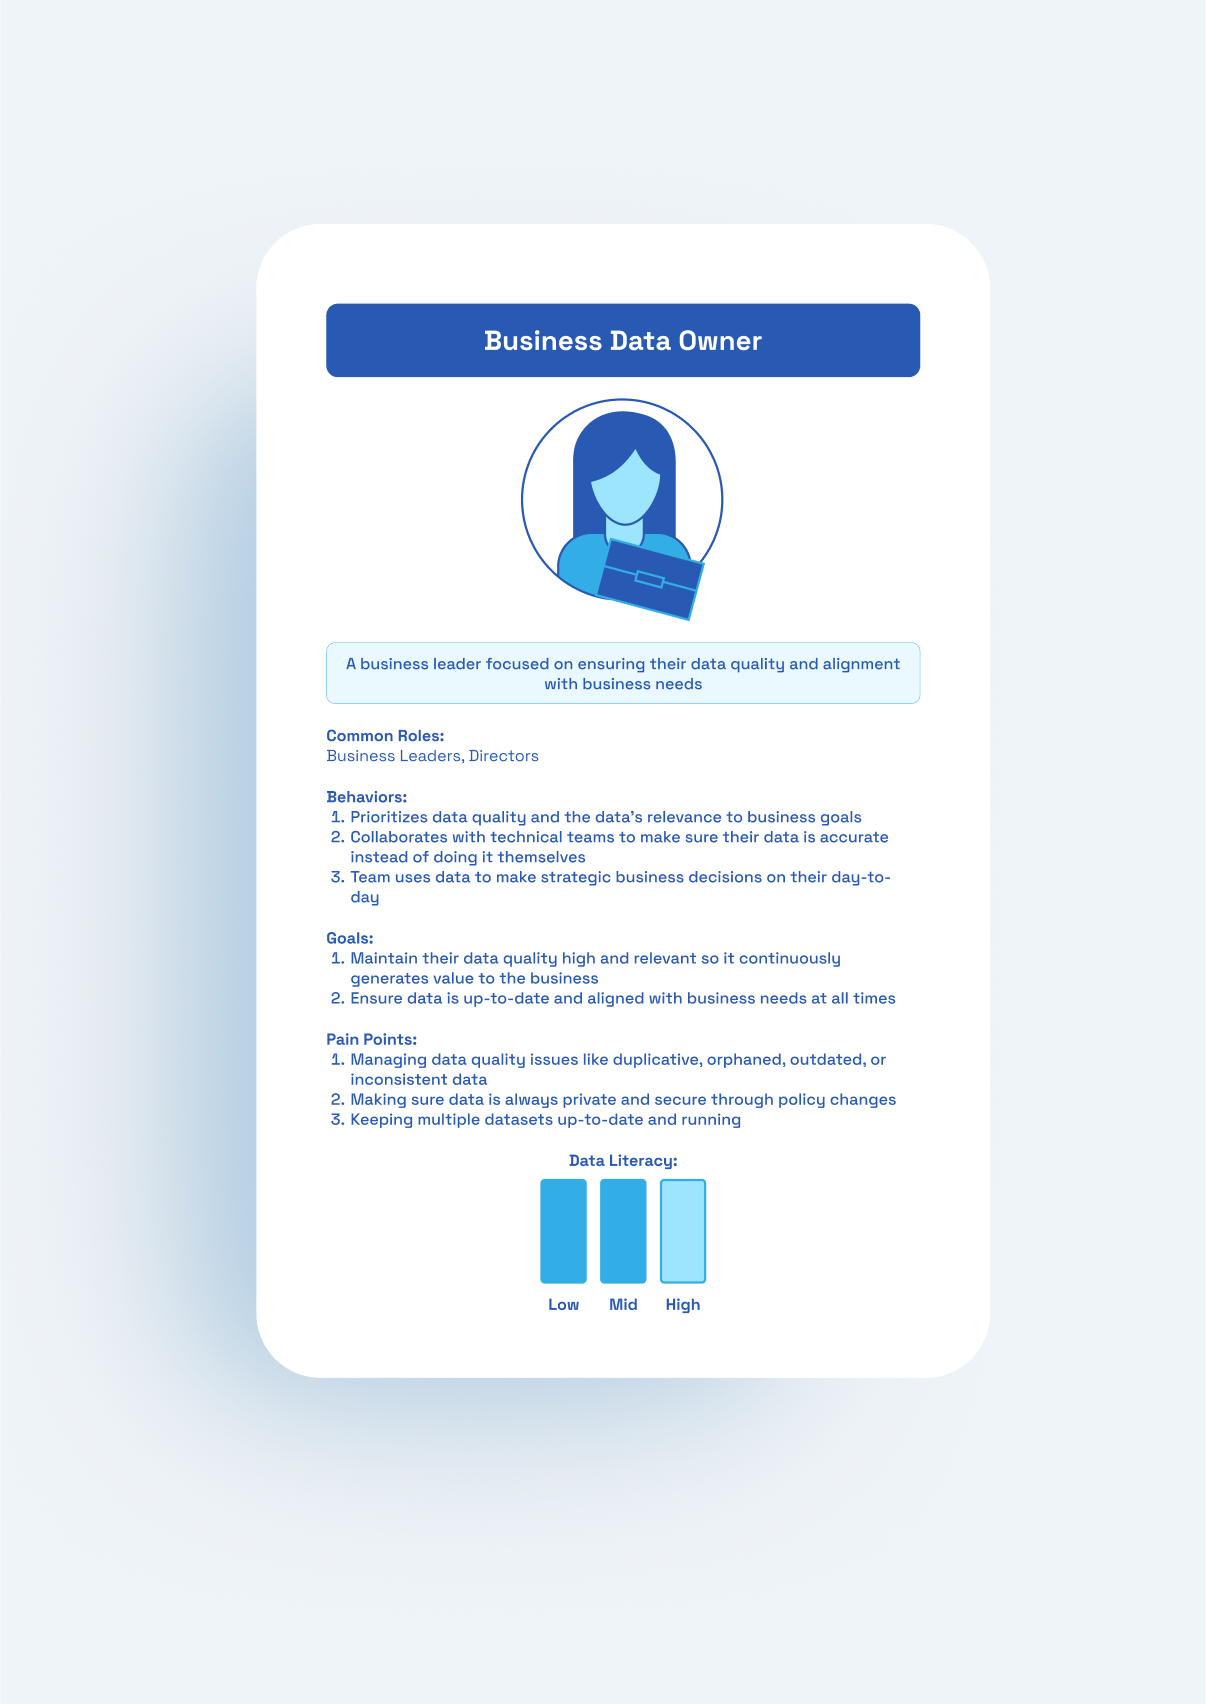
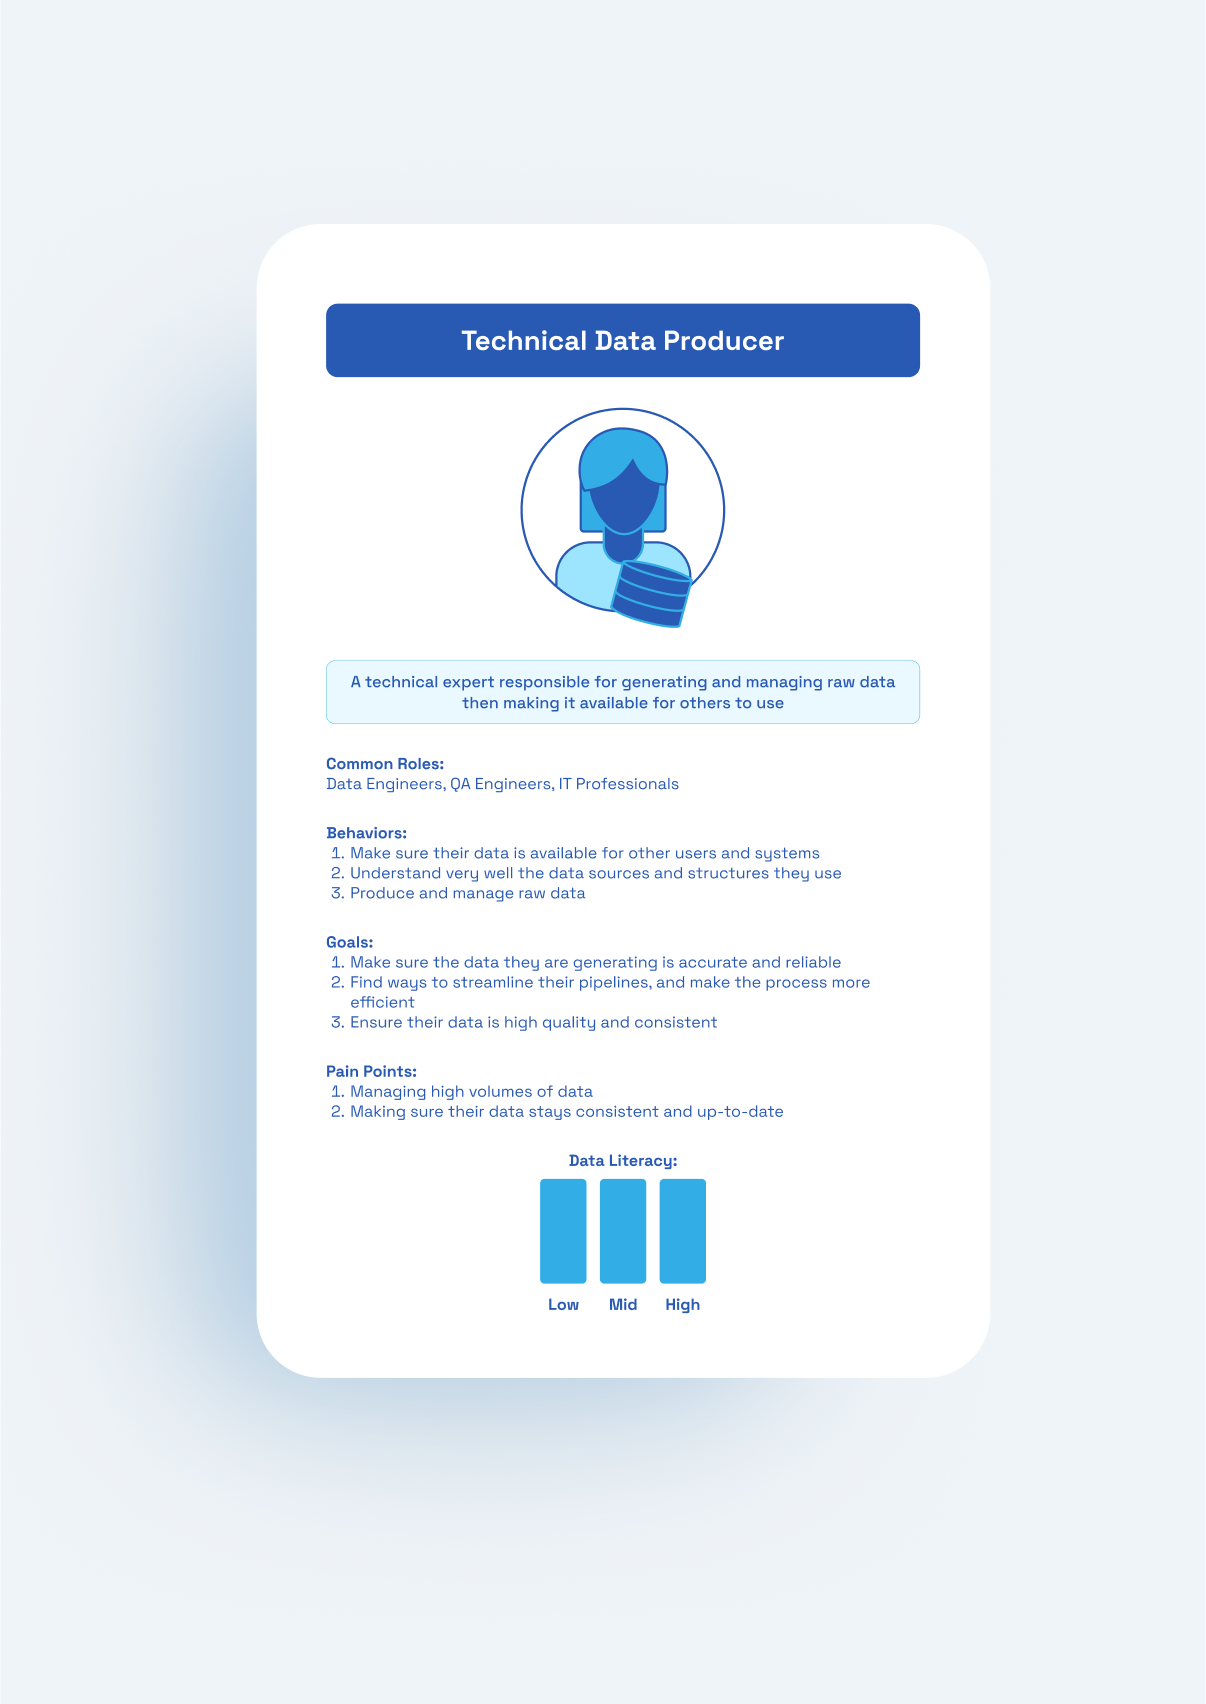
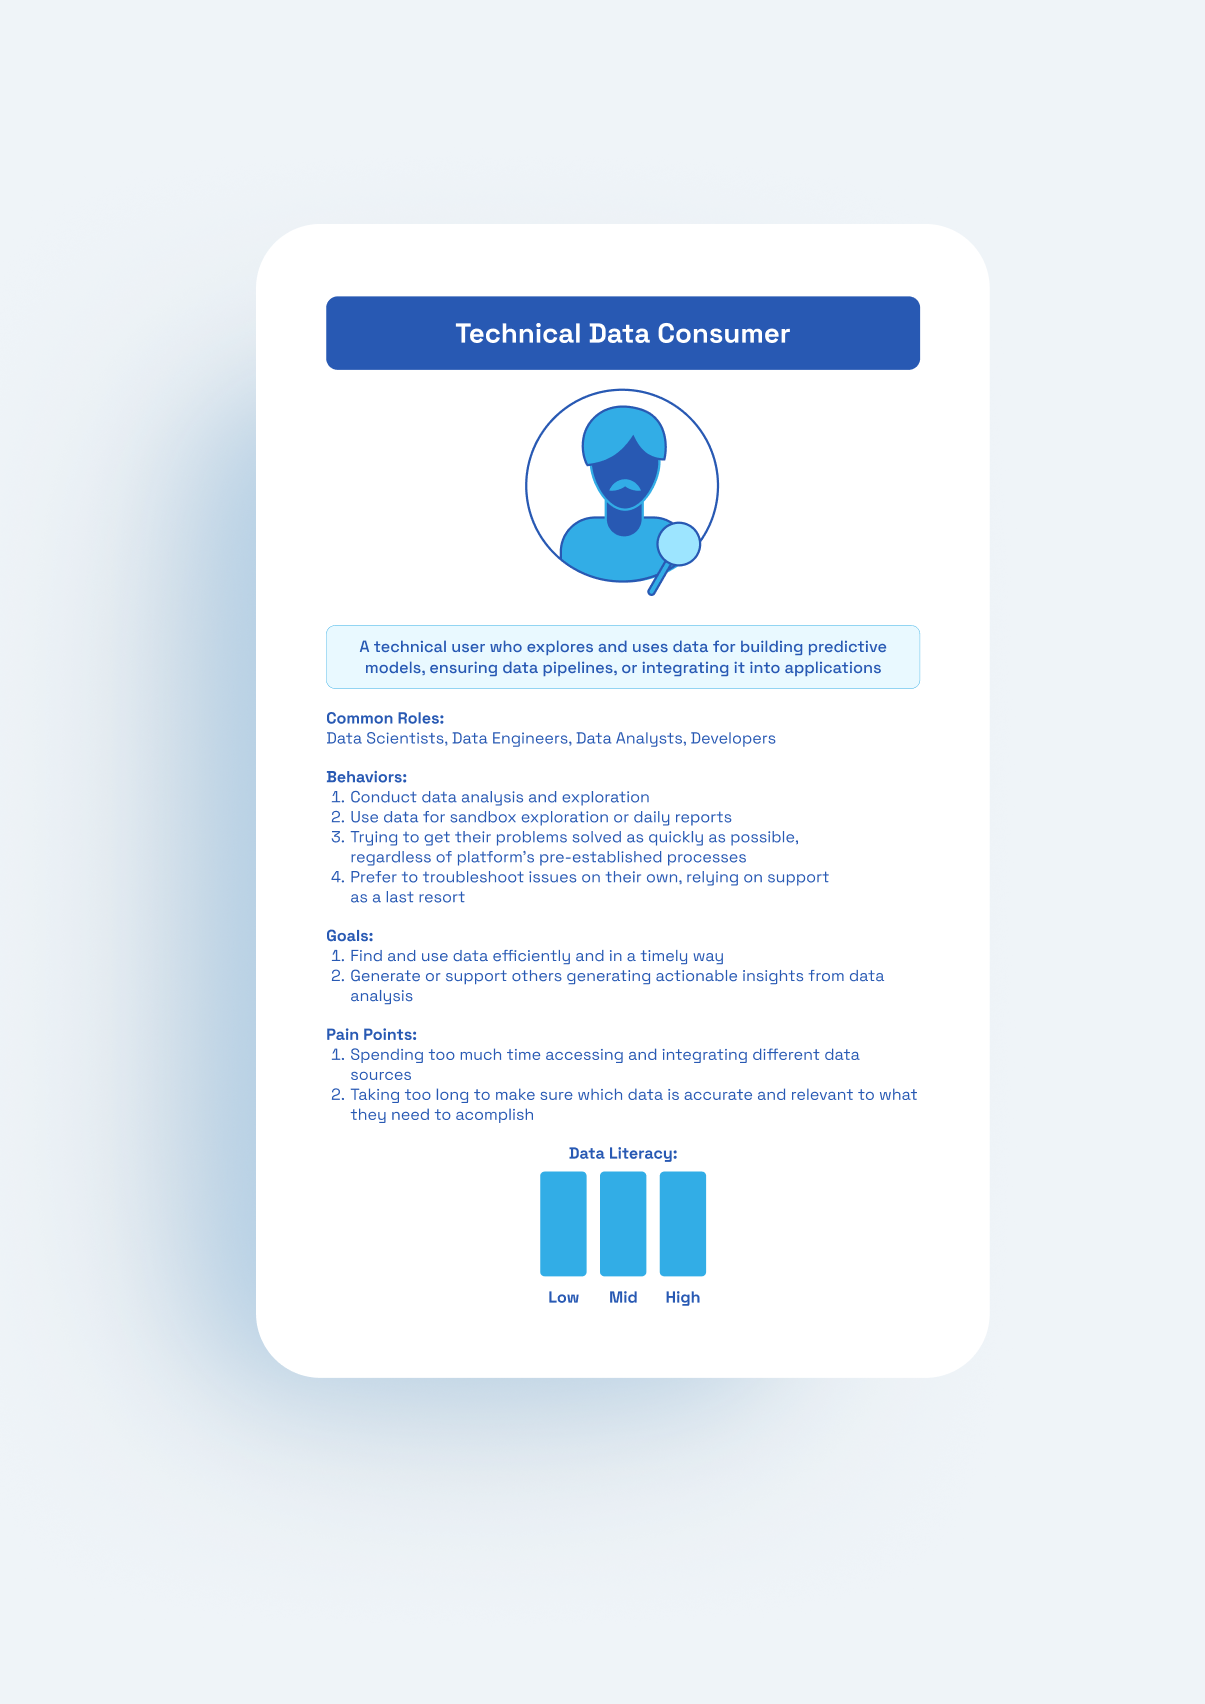
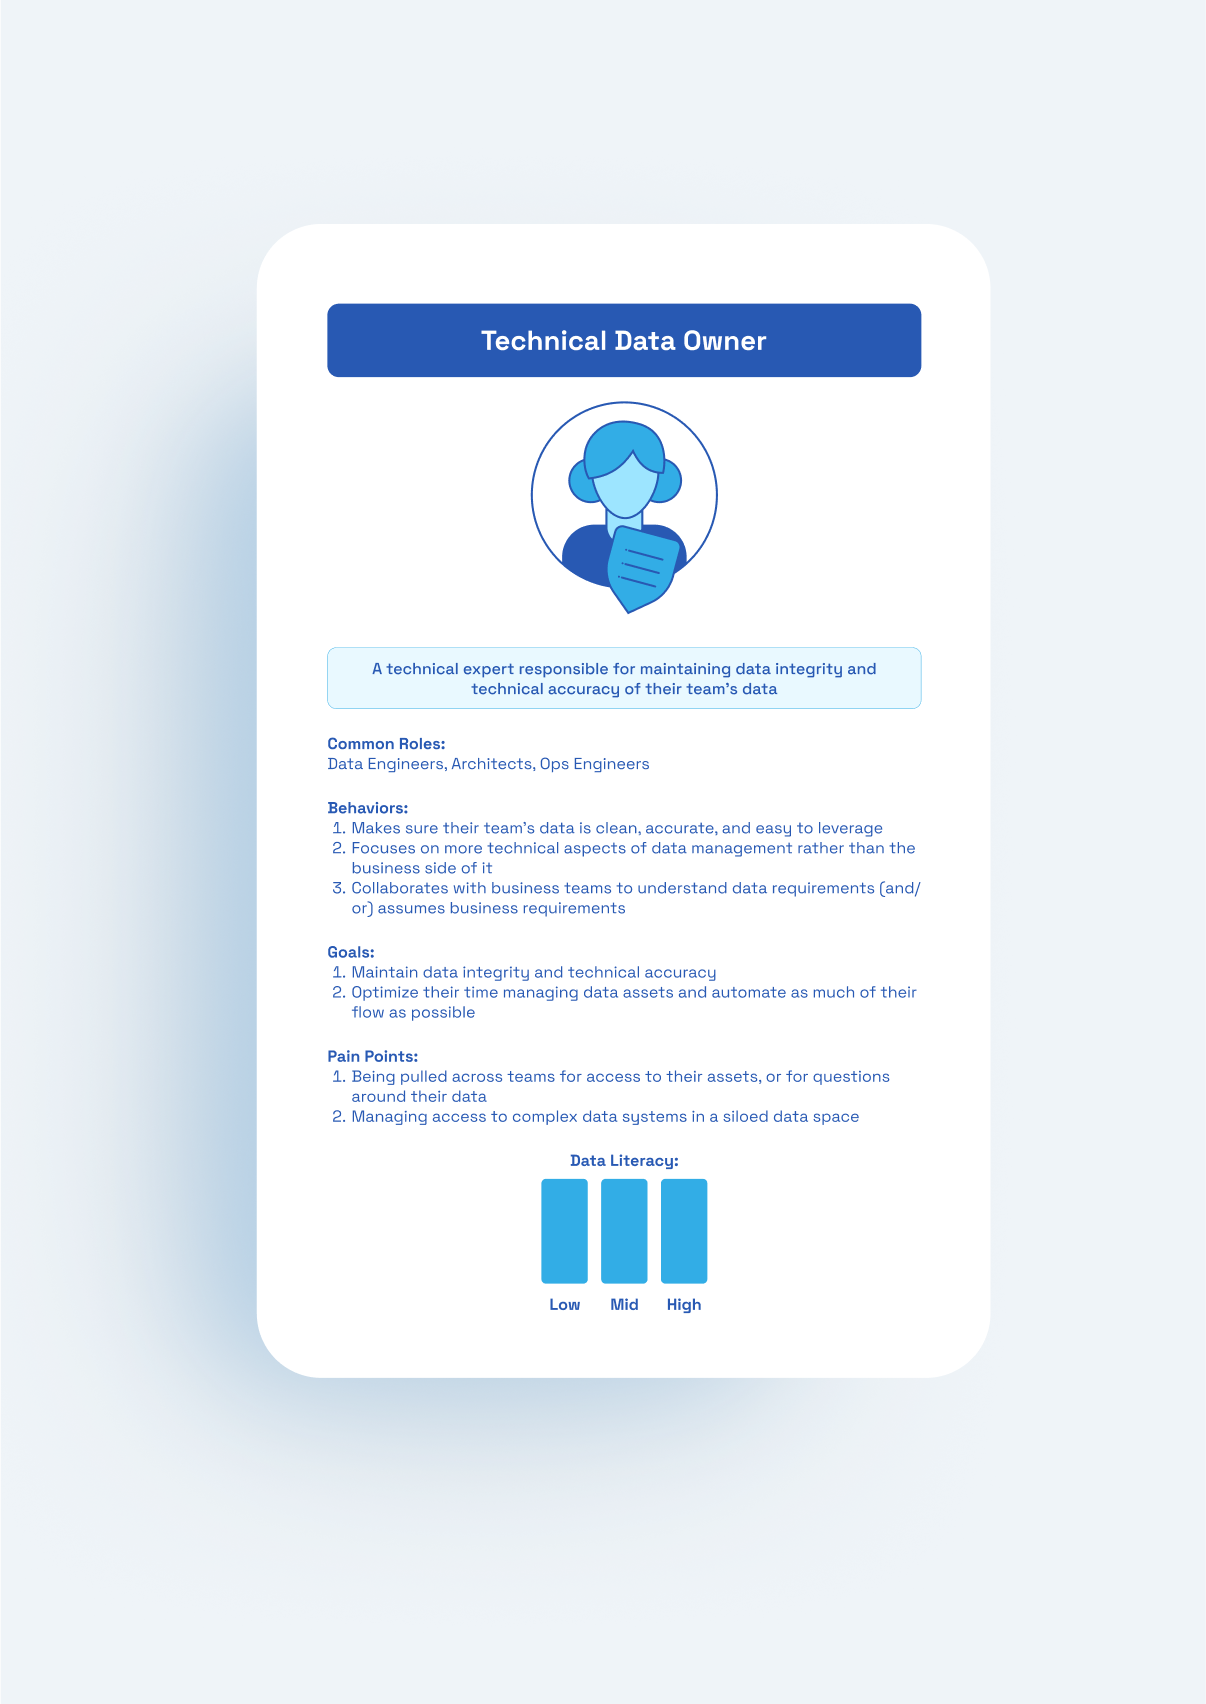
Replaced metaphor-based names with clear, data-use-oriented labels:
Business Data Owner, Technical Data Owner, Business Data Consumer, Technical Data Consumer, Data Producer
Standardized the archetype format to include:
Short introduction outlining focus and responsibilities
Common roles associated with the archetype
One to three concise bullets each for behaviors, goals, and pain points
A simple visual showing the data literacy level
Learning
Clear, role-based naming improved immediate comprehension and reduced the need for explanation.
A consistent, accessible, and actionable structure made archetypes easier to reference in meetings, documentation, and design discussions.
Visual indicators (e.g., data literacy level) provided quick context without overloading the archetype with text.
OUTCOMES
Produced a set of archetypes that moved away from overloaded persona details.
Established a conceptual framework for grouping users by behaviors and goals rather than job titles alone.
Adoption was limited due to the extra cognitive step required to interpret the names.
IDENTIFIED POINTS FOR IMPROVEMENT
Prioritize clarity over creativity in naming conventions to ensure instant recognition
Provide a consistent, structured format for each archetype to make them easier to scan and apply
Include role examples and key behaviors to bridge the gap between concept and practical use
Capture data literacy with more clarity, due to its importance in the current state of the platform and its development
ARCHETYPEs
outputs
5 finalized archetype cards showcasing Technical Data Consumer, Technical Data Producer, Business Data Consumer, Technical Data Owner, Business Data Owner
Interactive Tableau dashboard built from 180 survey responses
Reference deck outlining user goals, behaviors, and pain points
Standardized archetype template with: short intro, core roles, bullets for behaviors/goals/pain points, and a visual data-literacy indicator
Thank you for your time.